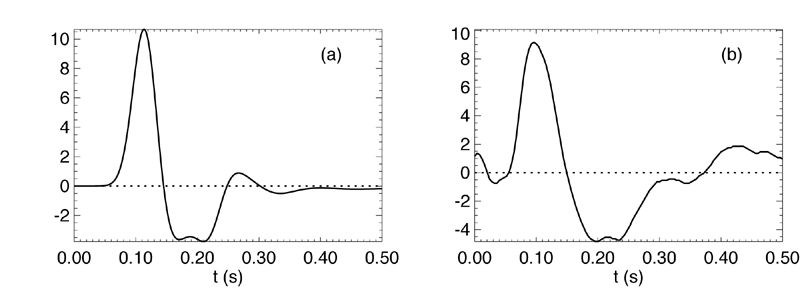
 Figure 9a
Comparison of (a) modelled ERPs with (b) experimental ERPs obtained from normal subjects in response to frequent (background) auditory tones. The modelled waveforms assumed parameter values all similar or identical to values used to model the ongoing EEG power spectrum (fig 8). In addition, it was assumed that a pulse reached (or was generated within) the cortex at t=0.1 s, and that there was a similar pulse subcortically at about the same time. The net effect of these two sources is to reproduce the characteristic biphasic waveform of auditory background ERPs.
|