Waldram DiagramsWritten by Paul BourkeMarch 2018
A Waldram diagram is used to calculate the percentage of sky that a building allows to the street below. As a relatively old technique it has the merit of being able to realidy drawn by hand given the profile of the building. Of course one might also interested in automatically creating such drawings, where they are required by councils for new buildings, from ones 3D models of the building and site. The four cases considered here are:
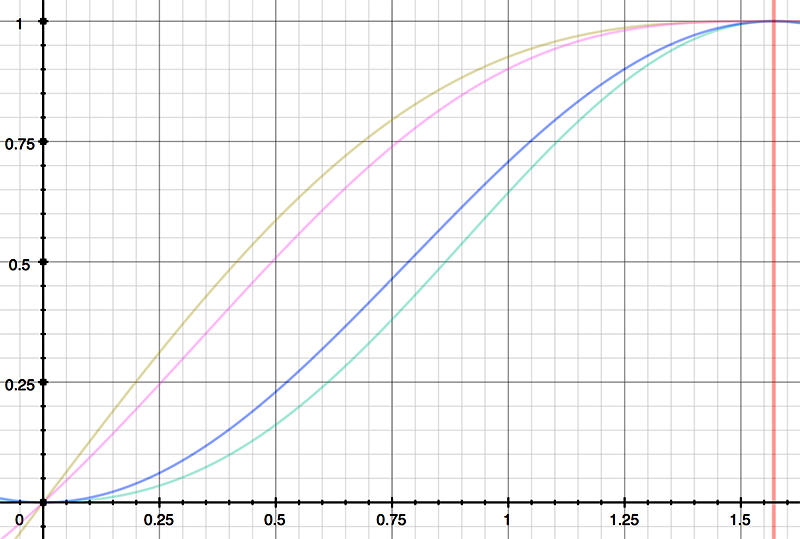
They can be applied over a 1/4 sphere (1/2 hemisphere) or a 1/2 sphere (hemisphere). In both cases the horizontal axis of longitude range from -π/2 to π/2. The vertical axis ranges from latitude 0 to π/2 for the 1/4 sphere, and latitude -π/2 to π/2 for 1/2 sphere case. The position on the vertical axis as a function of latitude (x) is as follows for each of the 4 cases. The horizontal axis is either proportional to the longitude (first 2 cases) or sine of the longitude (second 2 cases). 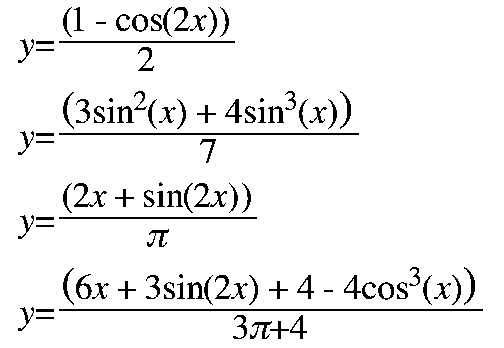
Since realtime graphics APIs such as OpenGL, and the higher level tools based upon them, do not immediately support other than orthographic and perspective projections, a common way to create arbitrary projections is outlined here for creating fisheye projections. In essence one captures three or four 90 degree field of perspective projections, where the view frustum is defined by the vertices of the faces of a cube. This is variably known as cube maps or cubic environments. Four faces are sufficient to capture what is visible in a hemisphere, note the virtual camera in the center of the cube points towards the midpoint along an edge rather than the more usual center of a face of the cube. These three or four renders are then applied to a mesh designed to achieve the correct mapping. The first case of a uniform sky on a horizontal plane (quarter sphere) is illustrated below. The first figure shows the left, right and top face of the cube. Note that in all cases only half the cube face is actually used. 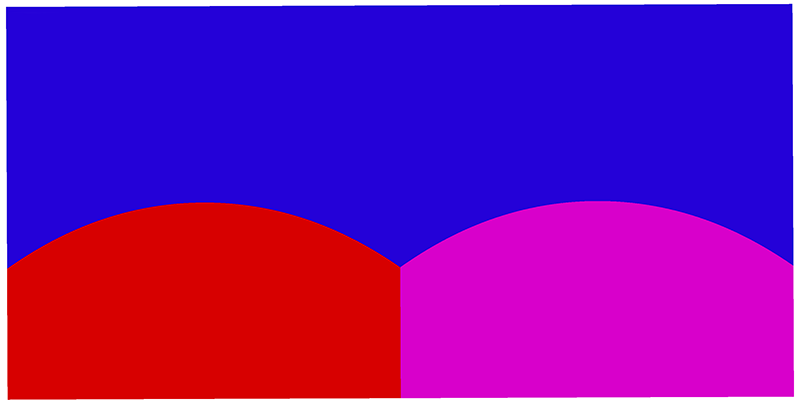
The mesh nature is shown below, the transformation is conveyed in the vertex positions, the uv texture coordinates at each vertex carry the longitude and latitude values from the original cube faces. 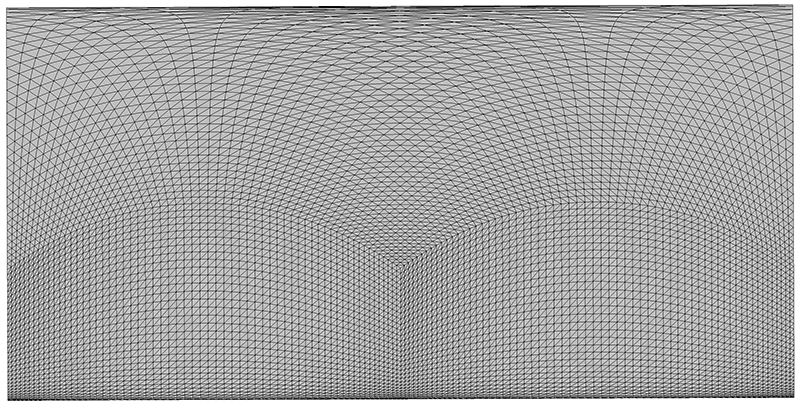
And finally the classical shape of horizontal features, in this case 8 thin cylinders extending from far left (negative longitude) to far right (positive longitude) and spaced in even 10 degree steps in latitude. 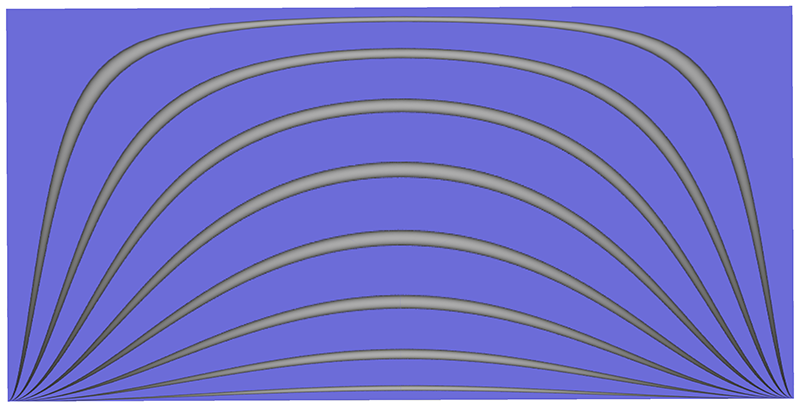
For reference, the following are the left, right and top faces of the cube render unfolded to lie flat. 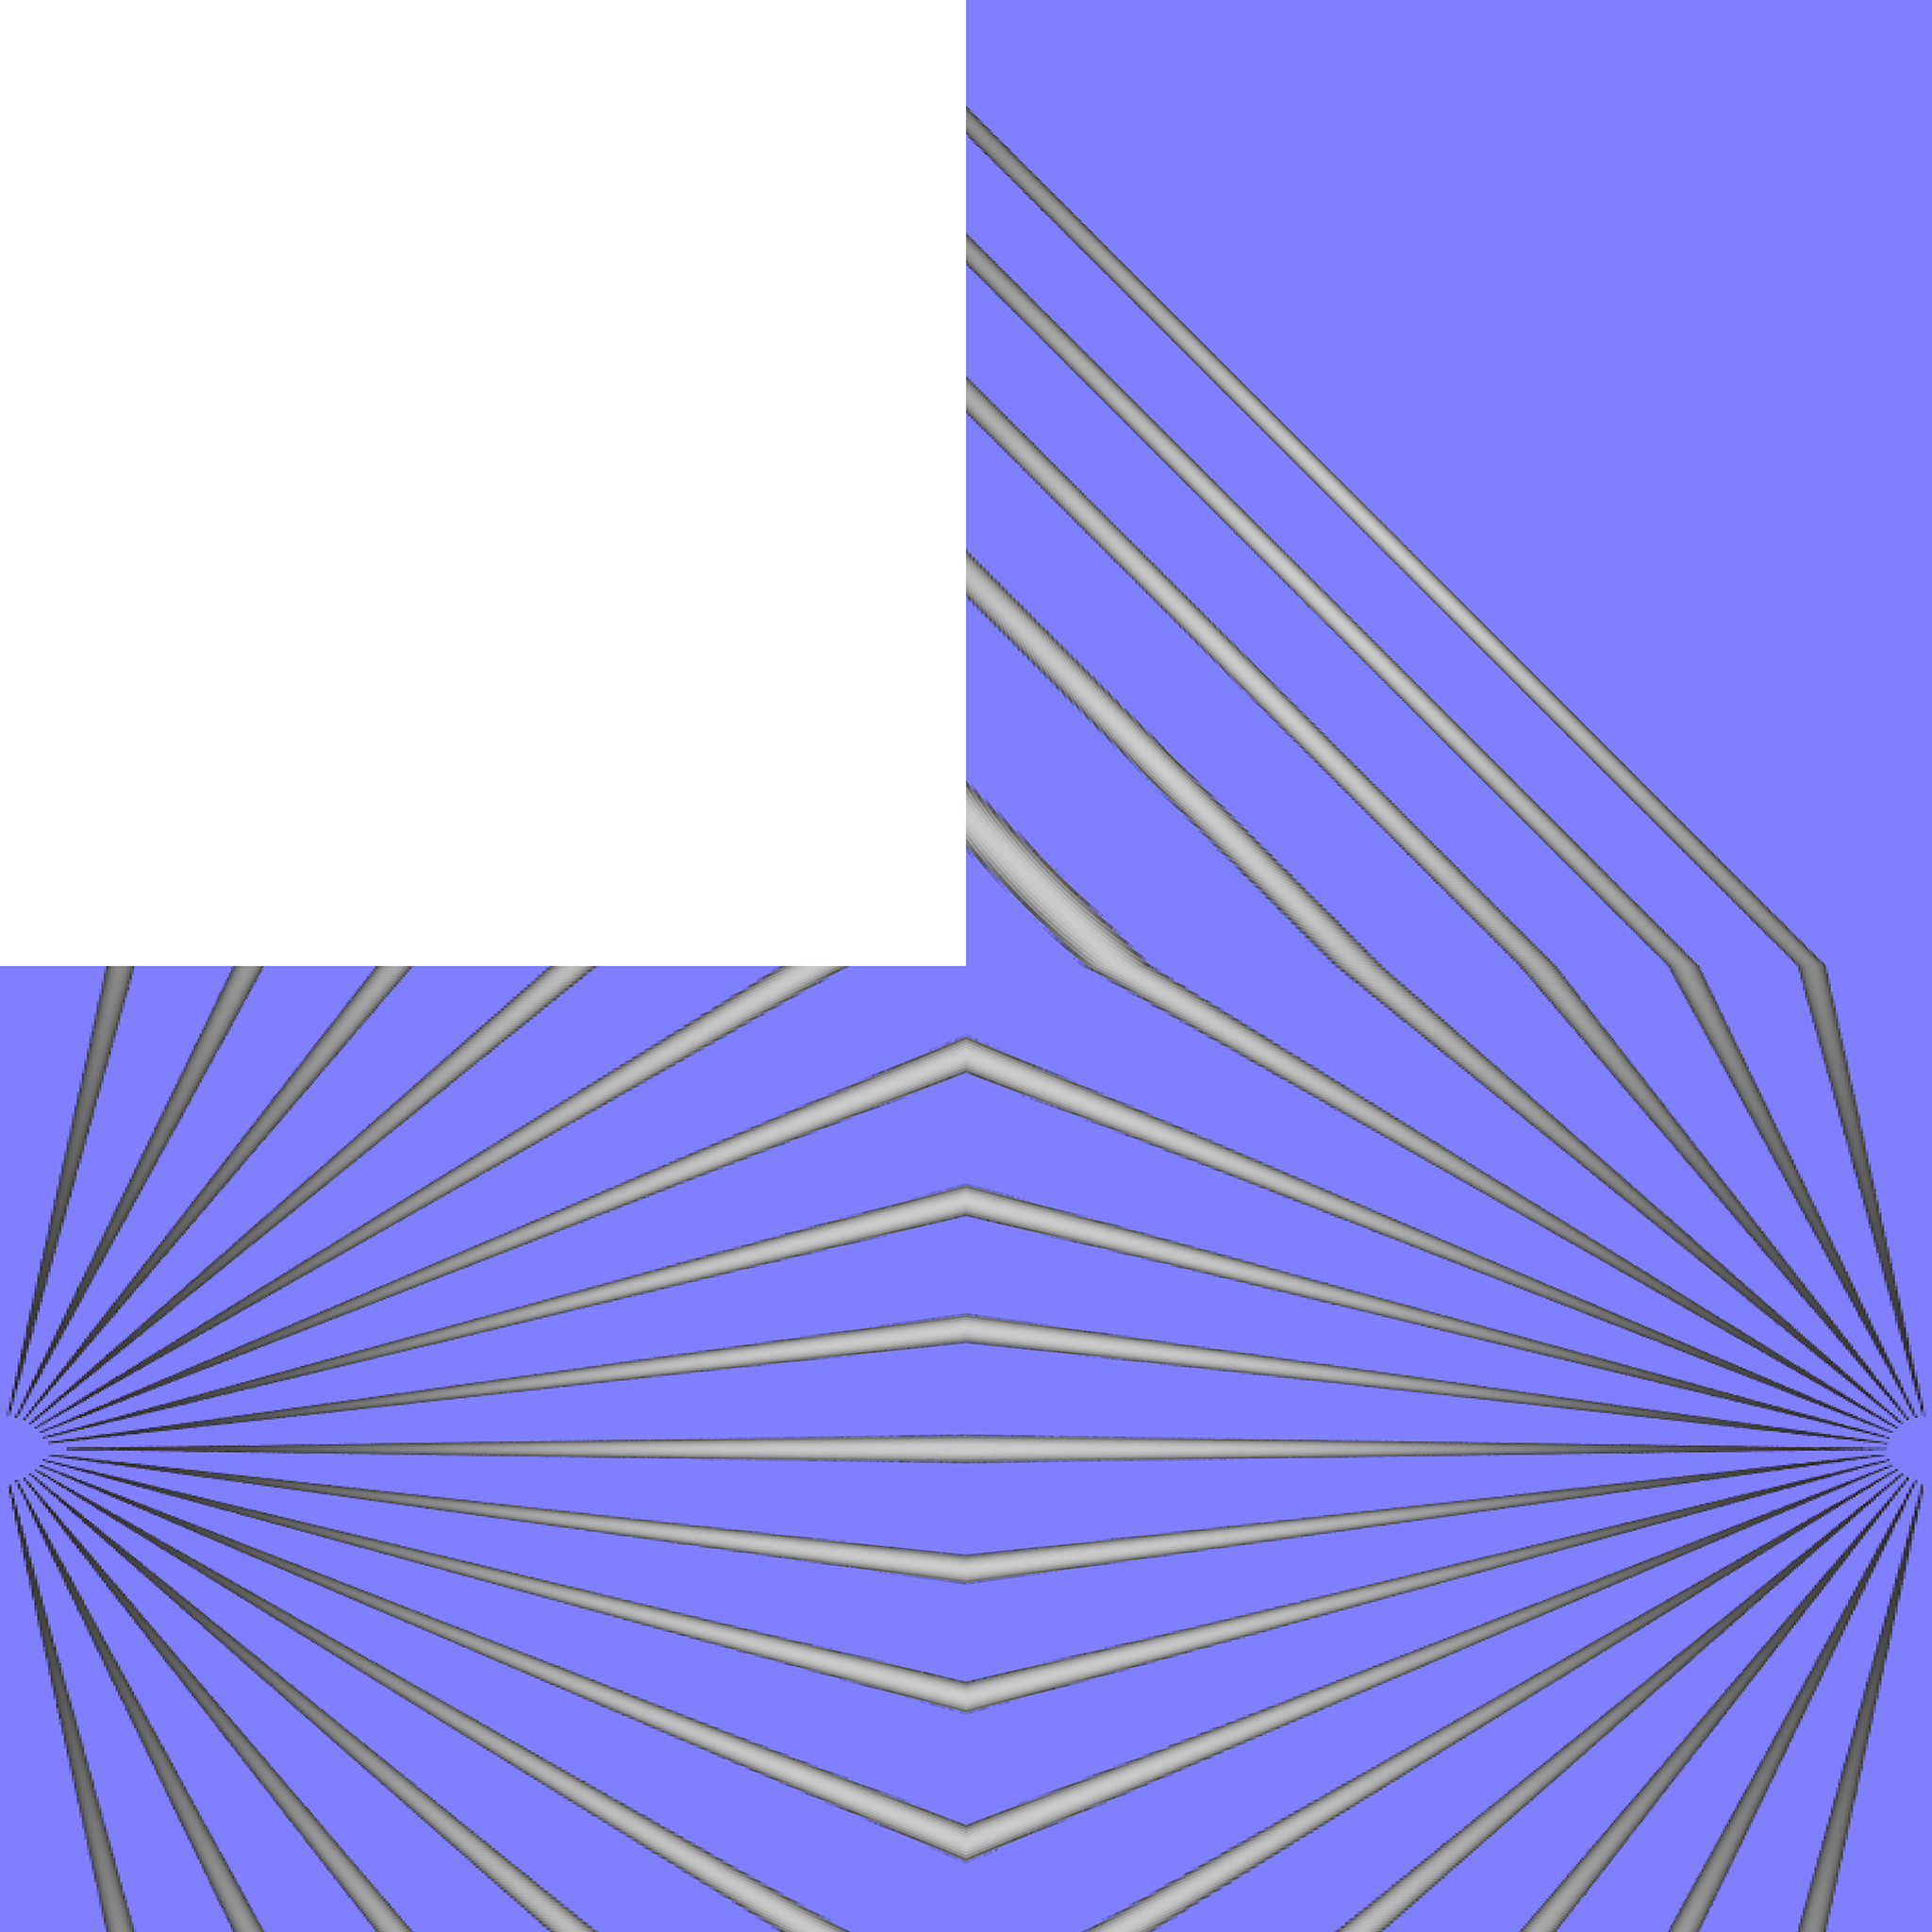
|