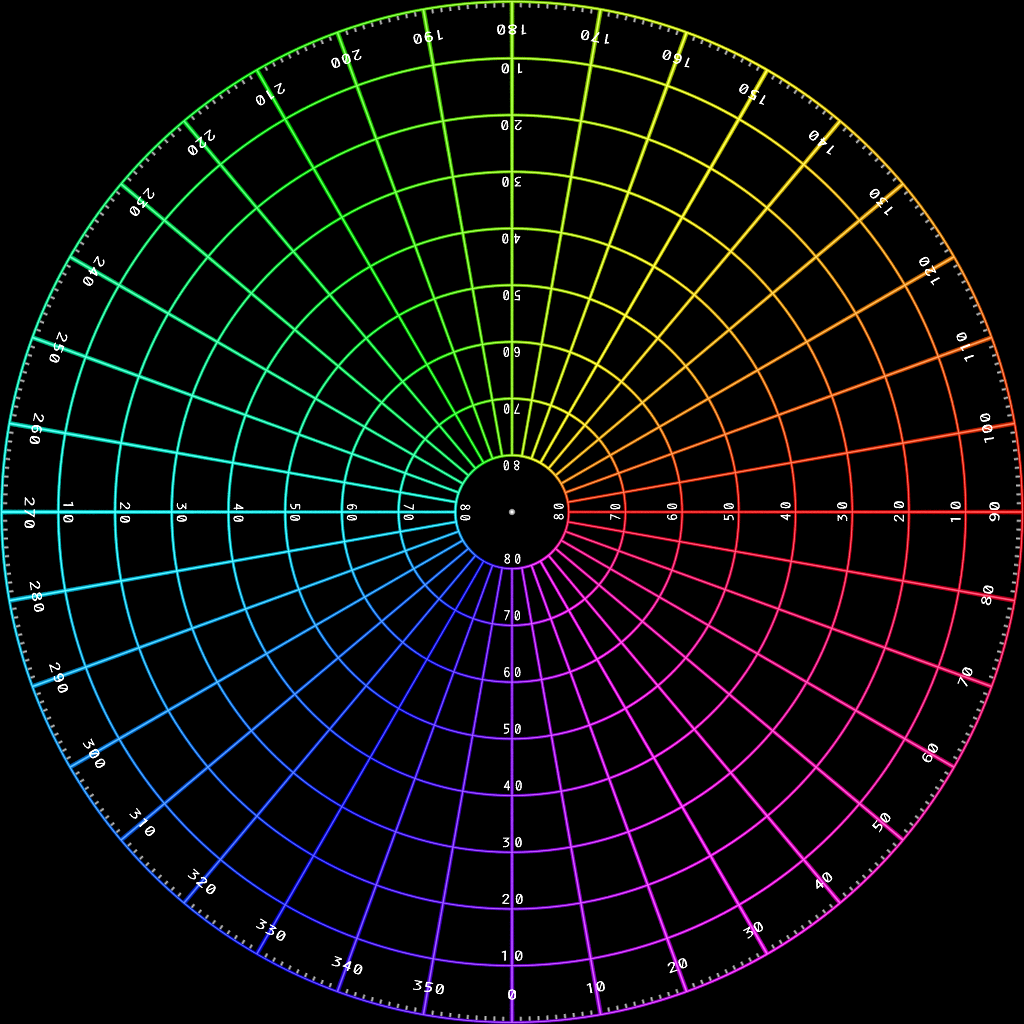
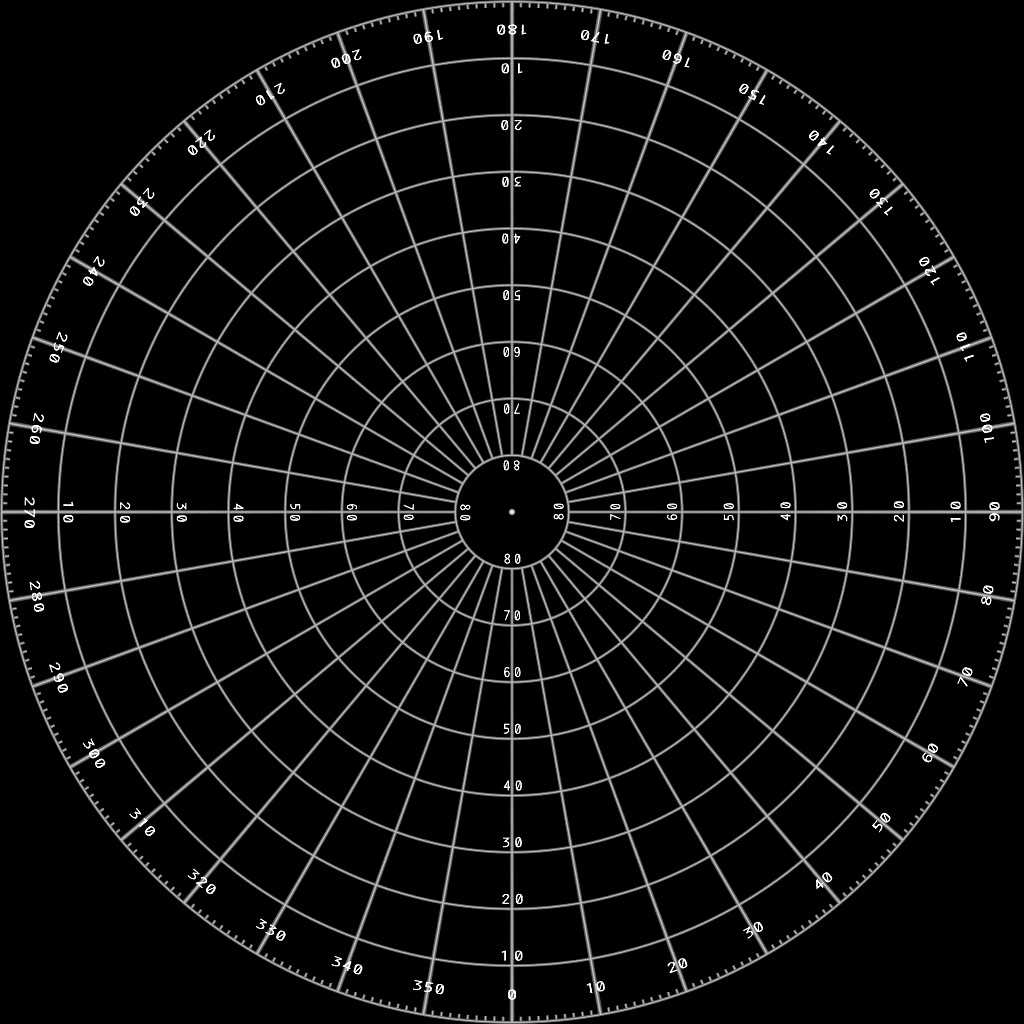
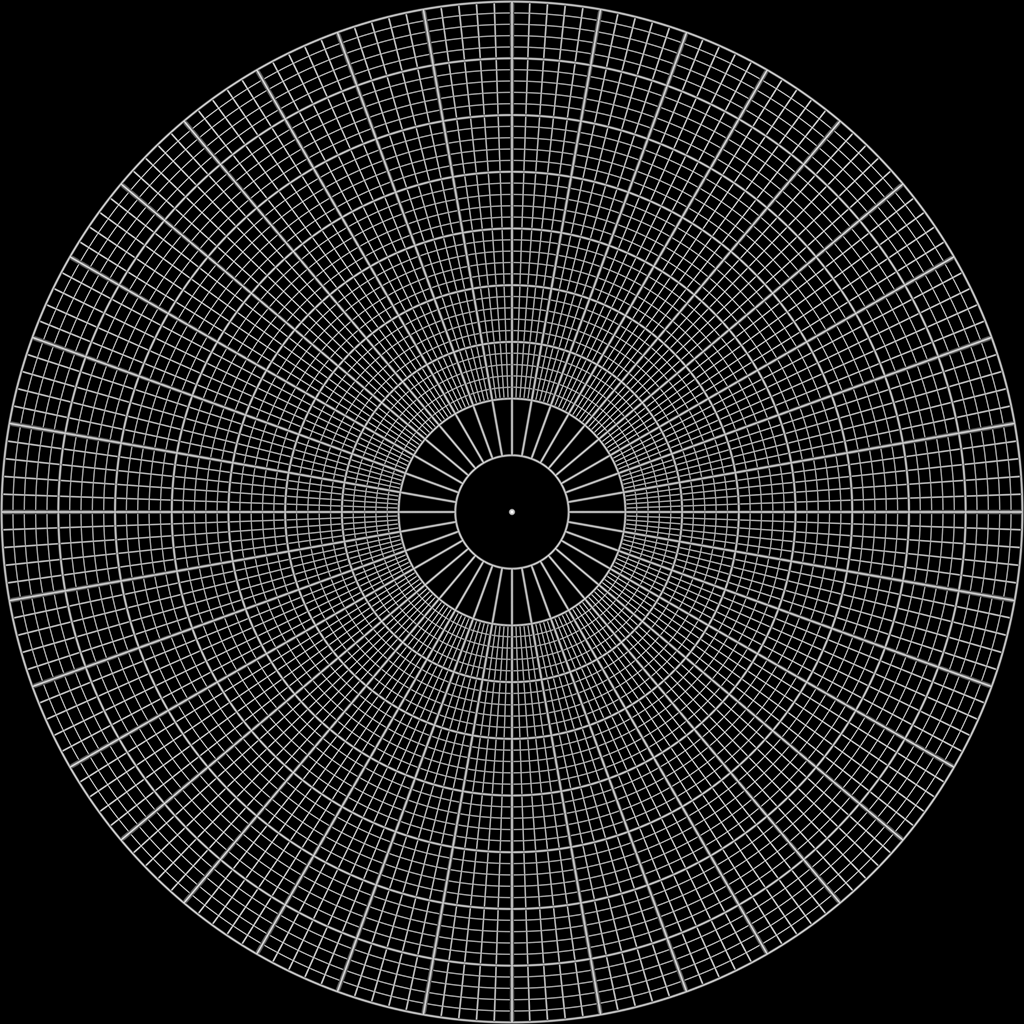
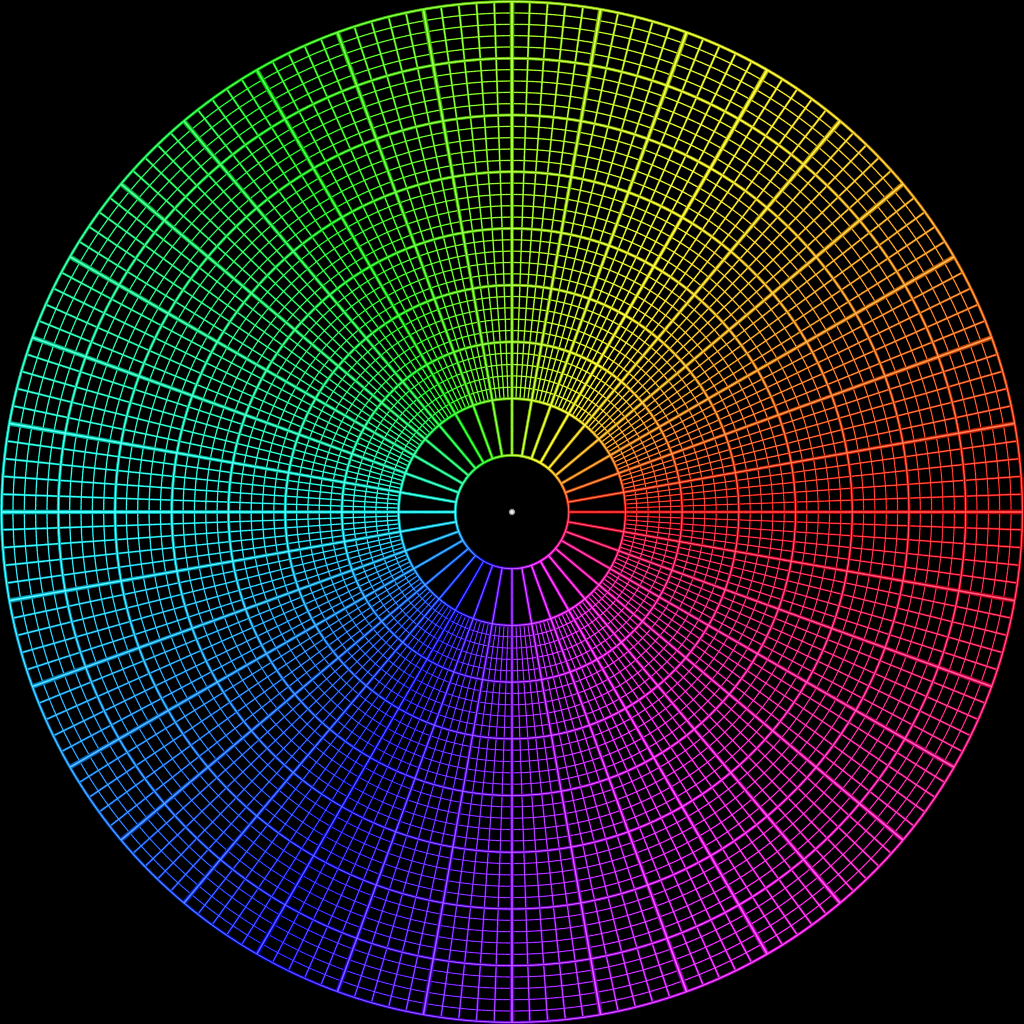
Digital fulldome test pattern
Written by Paul Bourke
First version: June 2018. Latest update: February 2022
v09, 25 June 2018. First release.
v10, 30 June 2018. Added star field, white patch, and bars near pole.
v11, 02 July 2018. Added identifying text and version number at the pole.
v12, 27 July 2018. Small changes based upon reader feedback.
v13, 07 March 2019. Colour and intensities of swatches have a gamma of 1.0, linear profile.
31 March 2021. Added option for a version with client logos.
See examples at end of this document.
22 January 2022. Added equirectangular versions, request by Michael Koch.
v14, 23 January 2022. A minor change to line spacings. Brings spherical and fisheye into line.
|
Introduction
In the digital fulldome world, for example planetariums, there are a number of
possible data projection options.
Ranked roughly in order of potential resolution these range from single projector and
spherical mirror, single projector and fisheye lenses, dual projectors and finally
multiple (typically 5 or more) projectors.
While single projector systems are simpler, their quality can vary depending
on the quality of the first surface mirror (for spherical mirror systems) and
the quality of the lens optics in the case of a single fisheye.
For multiple projector systems the situation is more complex and since
one is generally investing more in such systems the resolution is more important.
One cannot simply assume that more projectors are better, for example,
will more lower resolution projectors result in a
higher resolution result than say a system with fewer higher resolution
projectors? To what degree does the optical quality of the lens affect
the final dome resolution? What role does the different projection technologies
affect the actual result on the dome?
The following attempts to provide a method of estimating the true resolution of
a particular digital fulldome system. "True resolution" is taken to mean what the
projection system is actually resolving on the dome surface rather than any theoretical
resolution. Specifically, at
what point does a higher resolution input image not deliver any visual improvement,
or indeed can lead to a reduction in quality.
There are a number of reason why this is important, some are listed below.
The resolution claims of many fulldome suppliers are often more about marketing than
based upon anything in reality.
The approach presented here can serve to provide a single method that can be used to
compare different systems rather than trying to assess the
quality using different images supplied by each manufacturer/installer.
There can be many parts to the projection pipeline, each can affect the final quality.
Employing a standard test pattern allows one to adjust the quality of each stage
and see which is the limiting factor. For example, many systems (unfortunately) employ
a highly lossy movie encoding codecs; this can be the limiting factor rather than the number
of projectors or the resolution of still uncompressed images. [See comment below about
creating a movie based upon this test pattern].
Movie playback on fulldome systems is often challenging in terms of data transfer from
disk and/or decoding requirements. Knowing the maximum resolving capabilities of a dome
allows one to choose an appropriate movie resolution. Playing movies that are a higher
resolution than the dome projection can resolve is a waste of resources.
If you have convinced your funding source to invest in a dome resolution of X then after
it is installed you don't want to find out that it is not actually that resolution, or
only by a definition that may not stand up to close inspection.
Unfortunately there are not well defined metrics for measuring the actual dome
resolution. As such the various dome installation companies have invented their
own measures, as is the way with commercial rivals these measures are generally
invented to suit the company using them. In particular terms such as "4K", "8K",
"True8K" have ended up not meaning much at all but largely just serve as marketing terms.
For single projection systems the underlying resolution of the projector does not
necessarily match the final perceived resolution on the dome, for example, different
lenses have various degrees of chromatic error.
There are a number of possible definitions:
The worst, but not uncommon, is to imagine that because the movie playback software
supports 4K fisheyes then the system is representing that on the dome.
Counting the total number of pixels on the dome. So, for example, a dome
might be rated as having a resolution of 4K if it places 12.5 million pixels
on the dome (pi r^2 where r = 2K).
The quite reasonable definition proposed by Evans and Sutherland for True8K is that there
are 8K pixels along any half great circle curve on the dome, also known as a meridian.
By themselves none of these can be used to accurately determine what the projection system
can actually resolve. There are realities
inherent in all multiple projector systems on the market at the moment that makes a
theoretical evaluation problematic.
These are:
Limitations in the optics of the lenses employed. Not all pixels are
necessarily of equal quality. Some may be less in focus than others; some
may have more chromatic error than others.
Not all pixels are necessarily the same size. Pixels directly opposite
projectors tend to be a different size than pixels at wider angles.
Not all pixels are necessarily the same aspect ratio. Pixels directly
opposite projectors tend to be square but those at wider angles less so.
And the big one, how does one judge or count pixel resolution across
blend zones. Blend zones are notoriously imperfect even after relatively
short periods following the last warp/blend calibration.
Compression degradation. Most movie playback systems on the market employ some form of
data compression. Since this is designed to reduce the data
reading and decompression the result is a degraded version of the input
fisheye images sequence. This is particularly problematic for mpeg style
codecs, but also for the increasingly more popular HAP codec.
So, even before the image hits the projectors it is an inferior version of
the original.
The approach proposed here is a practical one. A metric for dome quality
(resolution) needs to be one that reflects the actual image quality on the
dome, sounds obvious but the definitions above do not generally measure that.
A better metric for describing the resolving power of a dome is to determine
the point at which increasing the resolution of the input image does not
improve the perceived quality. The test is easy and similar to the way one
determines the actual resolution of lenses for example. This is to photograph, or
broadcast, a known image (a test pattern) that has been designed to reveal the
resolving limits. The test pattern presented and adapted here for fulldome
contains similar elements used to determine the resolution for broadcast or lenses. One
defines this test fisheye pattern at "infinite" resolution (continuous not
discrete) and one renders that at various discrete resolutions,
presenting each on the dome. The true resolution of the
dome is defined as the point at which increasing the test pattern resolution
does not improve the result on the dome. An important feature of the test pattern
will be features at known spatial resolutions; a claimed dome resolution above
those spatial features should be able to resolve them.
Test pattern
License
Fulldome test pattern by Paul Bourke.
The images may be freely used under the condition it is not modified in any way.
The image may be freely distributed as long as this license statement is included.
A modified, custom or license free version of this test pattern can be created by the
author for a fee.
How to use this test pattern
The following describes the features of the image and how it might be used.
The text characters in all the images irrespective of the resolution are 12 pixels wide.
Pixelated for sure but easily enough pixels to represent numbers. On a projection system capable
of resolving a particular resolution the numbers should be clearly discernible, good
choices for inspection would be "0", "3" and "8".

In these images, irrespective of the resolution, the lines making up the polar grid
are two pixels wide plus any antialiasing.
These white lines are useful for picking up chromatic errors, which
are likely to be most obvious towards the extreme angles of any lens, especially wide angle
lenses. Noting that chromatic errors are not always due to lenses, some projector technologies
can also generate chromatic-like effects and the higher end models should allow that to be
corrected.
In the top right and bottom left quadrants are variously spaced lines (vertical and horizontal)
as well as variously spaced rings and radial lines. The white and dark zones should be resolvable by a
projection system of the corresponding (or greater) resolution. In particular the finest
rings give the best indication of the resolving power. If these structures blend into a solid
grey that is an indication that the resolving capabilities are lower than the test pattern resolution
being used.
The relative black to white widths are the same across all image resolutions, for example
the left of the image below is from the 2K test pattern and the right is from the 4K test
pattern.
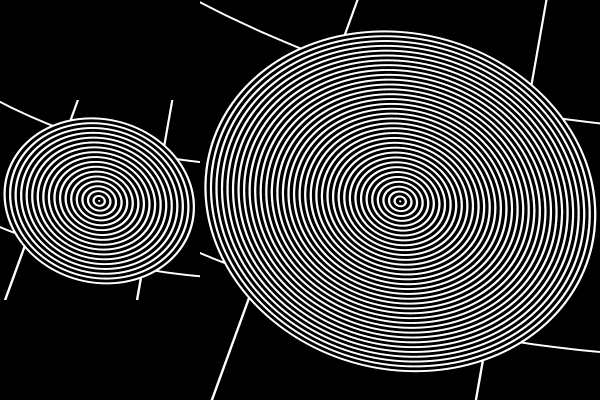
The points included might be used to evaluate star quality are progressively 1 pixel wide,
2 pixels wide, 3 pixels wide and 4 pixels wide.
The solid inset colour swatches are 50% and 100% saturation.
The grey scale inset swatches are 25%, 50%, 75% and 100% saturation.
The colour aspects of this test pattern can be more difficult to evaluate. One aspect
they are intended to highlight is colour banding due to a reduced colour range in
the projector or in the compression codec. The ramp from black to primary or secondary colour
and then to white in the top left and bottom right occurs in 255 steps, as much as 8bit
colour can support.
The test image as it stands is suited to estimating the quality of realtime
computer generated graphics.
If it is to be used to estimate movie playback quality then it needs to
be encoded into a movie. Only then will some compression artefacts
be observed. The movie should consist of this image slowly rotating about the north pole,
that is, this
image rotated about the center as each frame of the movie.
Note that performing this rotation "live" (if supported) is NOT necessarily
the same as actually encoding it into a movie.
The rotation should
be slow in order to pick up aliasing and blending errors.
Shimmering of lines is the classic indication of aliasing that occurs when a high
resolution image is downscaled to a lower resolution one.
The images have been created with a gamma of 1.0 and a linear colour profile.
While not the main purpose of this document, the test pattern is an excellent way of identifying
any non-smooth playback. The author recommends a 360 rotation in 1 minute, 1800 frames for a
30fps playback system and 3600 frames for a 60fps playback system.
Notes
The use of "K" to represent 1024 rather than 1000 is due to historical reasons
within the digital fulldome movie industry. These stem from the fact that for computer
playback frames that are a power of 2 in dimension can more readily take advantages
of GPU hardware. Although this is increasingly becoming less of a consideration.
Overlooked in this discussion is dynamic range and colour depth. These
are more difficult to quantify through observation although the colour ramps
are an attempt to do that in a simplistic way. They are also confounded by many lossy
compression codecs many/most of which reduce colour depth as well as spatial resolution.
The author can supply the slow rotating movie frames referred to above at a
range of requested resolutions but this would involve a fee for a USB drive and postage.
Noting that for a correct test each frame should be rendered from the infinite version
of this test pattern rather than simply rotating the representative image provided.
Please contact the author by email for more information.
Other backgrounds
Note these have constant real-world width of elements, unlike the test pattern
above which has pixel scale elements.
Spherical mirror
I have been asked for a prewarped version for a spherical mirror projection system but this is
much more problematic since the warping is potentially different for every installation.
Indeed prewarping is definitely NOT a good idea in any circumstance.
An example is provided below for a full HD projector (1920x1080) using one of the
configurations I set up initially. To use these test patterns for a spherical mirror
system you should simply run the appropriate resolution fisheyes provided above through
the realtime warping software from your system provider. If you really want a
prewarped version then if you send me the warp file for your system (typically
from your suppliers calibration software)
then I can create one for you. Note also that the appropriate fisheye resolution to use
is also not as simple as for fisheye lens or multiple projector projection. Roughly,
for a 1920x1080 projector and spherical mirror, the best fisheye image resolution is
about 1600x1600 pixels. This will ensure that one is not limiting the resolution by
choosing too low a fisheye resolution, nor wasting computer performance with no visible
image quality by using a too high fisheye image resolution.
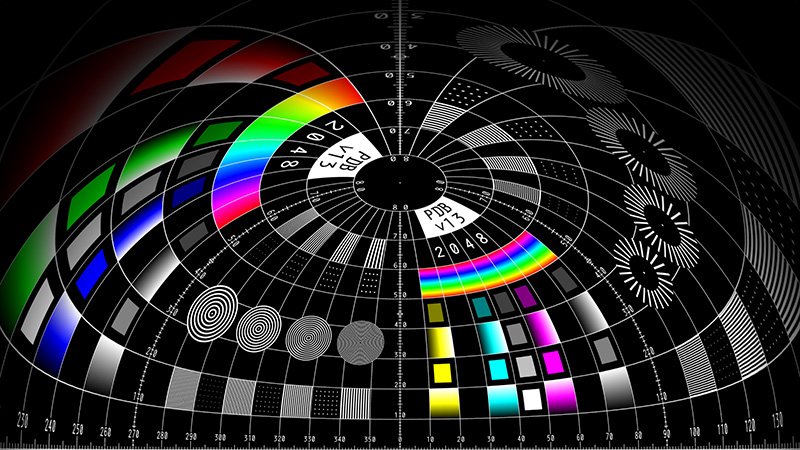
Customised version with a logo and "pdb" branding removed
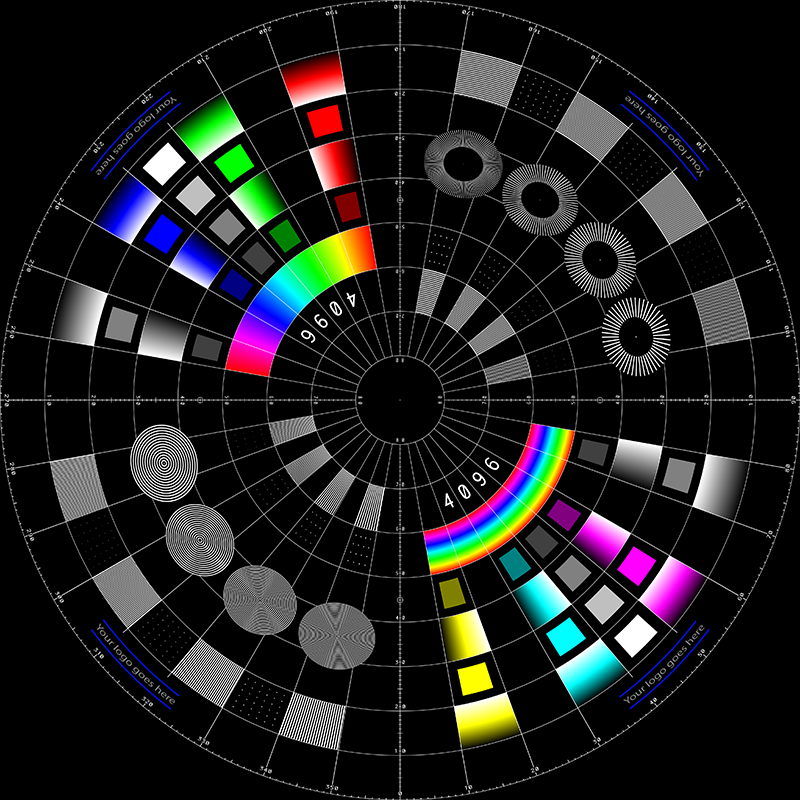
For those who may like a customised version of the test pattern with their own, or a
clients logo, this is now available for a fee (contact the author).
The exact layout and positioning of the
logo is adjustable, the default location is as shown below for the 4K version of the
test pattern.
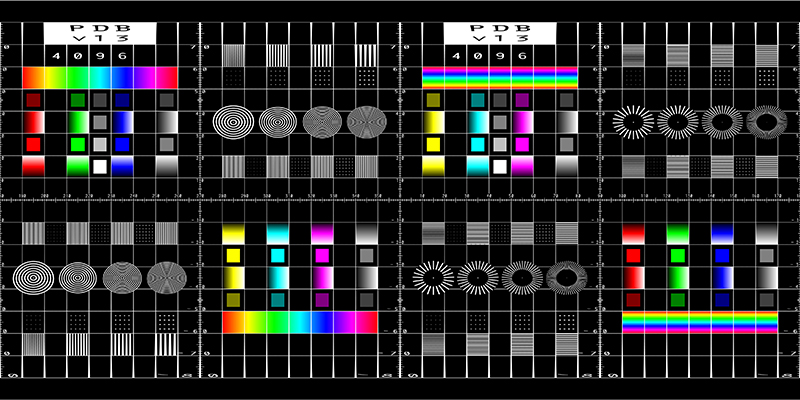
Equirectangular versions
Equirectangular versions are supplied in the following sizes:
2400x1200,
4096x2048,
4800x2400, and
8192x4096.
|


