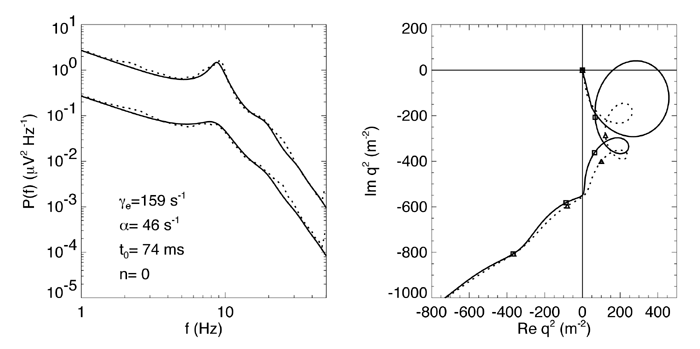
 Figure 8
Left hand figure: EEG power spectral average for 50 subjects. Upper set of dotted curves for eyes closed, lower set for eyes open (scaled for clarity). Fits to model shown as solid lines. Parameter values shown on graph: t0 is the conduction delay in the thalamocortical loop; n is the number of neurons in this loop (here set to zero to lump corticothalamic delays into the single parameter t0). Gamma and alpha are delay parameters related to the equivalent terms in Table 1. Fits were achieved by varying only the fraction of thalamocortical feedback and the general level of cortical gain, including cortical activation. Right hand figure: Complex loci of the wavenumber-independent part of the spectral content attributable to the thalamo- cortical resonance alone. Solid line eyes closed - dashed, eyes open
|