


|

|

|
|

|
|
|
|
|
|
|
Total solar eclipses allow astronomers a unique view of the outermost layer of the Sun, the Corona. The Sun (and all stars) has four main regions. The Interior, the Photosphere (about 400 km thick), the Chromosphere (about 1,500 km thick with prominences or spicules sometimes as high as 10,000 km above the photosphere), and the Corona.
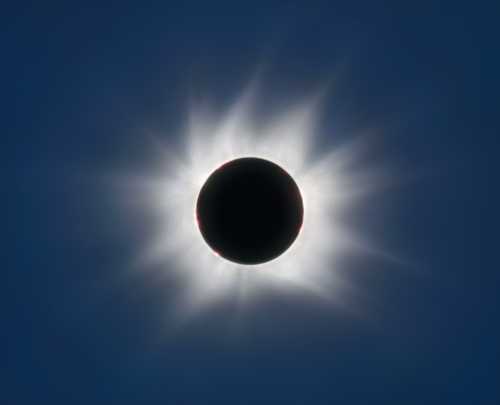
The corona extends as much as several million km from the Sun. (For comparison, the average distance of the innermost planet, Mercury is approximately 60 million km from the Sun). The corona is extremely faint, especially when compared to the much brighter photosphere. Hence, to view the corona somehow the inner, brighter regions of the Sun need to be blocked. It is somewhat convenient then, that the Moon, when exactly in front of the Sun, blocks the photosphere and gives us a chance to view the corona (Figure 1).
 |
|
| Figure 1. Total Solar Eclipse in visible light. Processing by Wendy Carlos of eclipse photographs by Jay Pasachoff. © 2000 by Wendy Carlos and Jay M. Pasachoff. | |
Figure 1 shows an image of a total solar eclipse, which shows that the corona has structure in the form of streamers, loops and plumes. These features can change shape on timescales of days and weeks. During an eclipse however little noticable change will be seen in the structure. The physical conditions of the corona are quite remarkable. It is a very low density gas, some 14 orders of magnitudes less dense than in our Earths atmosphere. This low density explains why it is so faint compared to the higher density photosphere.
One of the most remarkable properties of the corona is its temperature. You may expect that because it is further from the surface of the Sun than the photosphere and chromosphere, it would be cooler. In fact, it is much hotter. The chromosphere is about 104 K, then on the way to the corona a thin transition region exists which rapidly rises in temperature to the corona at typically 2 x 10⁶ K. Many emission lines reveal the temperature structure of the corona. For example, at 530.3 nanometres a bright (green) line is observed. This is due to ionised Iron (Fe) atoms that have lost 13 of 26 original electrons. This highly ionised Fe (Figure 2) can be produced with tempartures around 2 x 10⁶ K and higher.
 |
|
| Figure 2. Total Solar Eclipse in light of ionised Fe. | |
Hence the corona is approx. 100 times hotter than the chromosphere. The reason for this is slowly being resolved.
The extremely high temperature of the corona is thought to be related to the behaviour of the solar magnetic field, which can store and transport energy from lower regions of the Sun up into the corona.
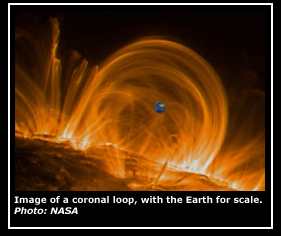
Images of coronal loops and arches made by NASA's TRACE (Transition Region and Coronal Explorer) spacecraft, lead astronomers to believe that they have found the heating mechanism that raises temperatures in the corona. TRACE images indicate that most of the heating occurs low in the corona, near the bases of the loops as they emerge from and return to the solar surface. The new results confound the conventional theory which relies on heating the loops uniformly. This tantalizing TRACE image (Figure 3) shows clusters of hot coronal loops which span 30 or more times the diameter of planet Earth. The intense heat of the corona may be generated when the magnetic fields shift and slam together. This process is called magnetic reconnection.
 |
|
| Figure 3. TRACE image of coronal loops. | |
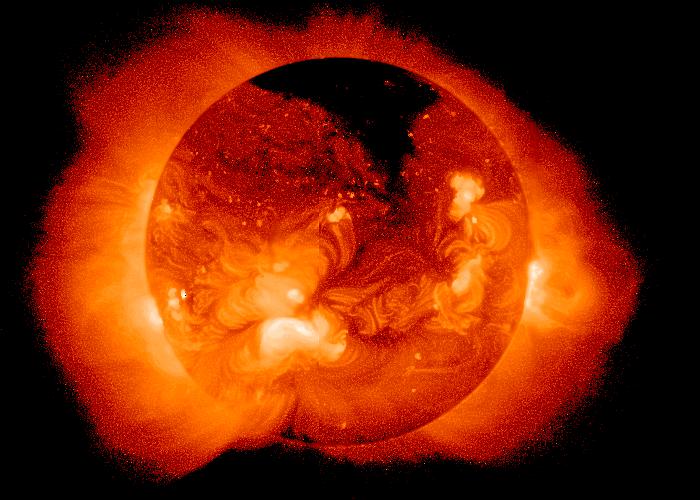
Other wavelength regions can be viewed in order to study the corona. The extreme temperature of the corona also allows it to be viewed in X-rays (Figure 4).
 |
|
| Figure 4. Total Solar Eclipse in light of X-rays. | |
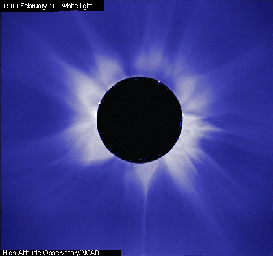
Outer regions of the Sun, including the corona, can also be studied by using a special instrument called a coronagraph (or coronameter). This artifically blocks the disk of the Sun (see Figure 5).
 |
 |
| Figure 5. The solar corona during the 1980 solar eclipse (left) and the 1988 solar eclipse (right). The 1980 eclipse was near a solar activity maximum and the 1988 eclipse was near a minimum | |
In the 1930's, a French astronomer, Bernard Lyot, solved the technical problem of creating an artificial eclipse of the Sun with a telescope. He designed the coronagraph, with which he secured on 12 July 1931 at the Observatoire du Pic-du Midi the first photograph of the corona ever taken outside of eclipse. He also went on to obtain the first cinematographic movie of solar prominences. Lyot's coronagraph also allowed extensive spectroscopic studies of the faint coronal lines. Lyot himself noted the surprising width of these lines, a crucial clue toward the realisation that the coronal gas is very much hotter that hitherto believed.
 |
|
| Figure 6. Bernard Lyot (1897-1952) | |
Even when using a coronagraph there are observational limitations. Light is scattered by both dust and molecules in the earth's atmosphere, and the brightness of the white light corona ranges from one millionth to one billionth of the central solar disk brightness. The coronagraph flown on the 1973 Skylab mission solved this problem by observing from a location on the Apollo Telescope Mount. By using a coronagraph in space, it became possible to made eclipse like observations as often as one wished for an extended period of time. In the case of Skylab, the mission lasted almost nine months, about nine solar rotations, but only one fifteenth of the duration of the solar magnetic variability cycle.
The coronas high temperature means that its constituent atoms and ions are moving with very large velocities. Sometimes these velocities are as large as 1 million km/hour. This outpouring of coronal gas is known as the solar wind.
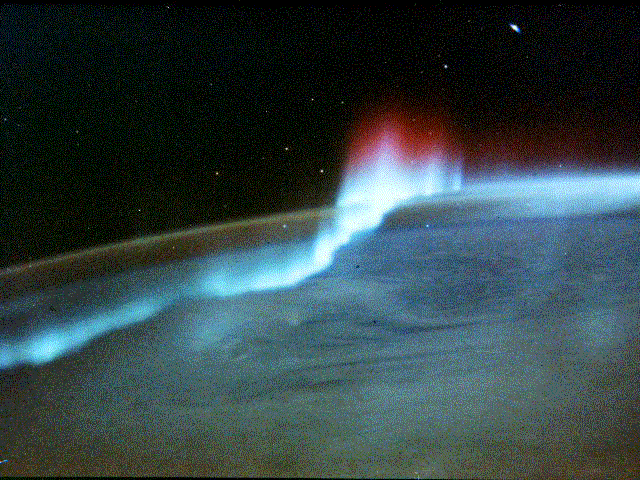
The solar wind is almost entirely made of nuclei and electrons of hydrogen and helium, however due to the Suns immense size, over the course of the solar lifetime only a fraction of a percent of the solar mass will be lost to it. Aurorae seen near the north and south magnetic poles (Figure 7) on Earth are due to interactions between the winds ions and electrons and our upper atmosphere.
 |
|
| Figure 7. Space Shuttle photo of red tipped auroral arcs over the South Pole. | |
Local time: Tuesday, 17-Feb-2026 05:37:07 EST