Plans and elevations from Laser ScansWritten by Paul BourkeJuly 2019
The following is a short note on creating plans and elevations from point clouds, typically from laser scans. The application in this case was creating images that would form the basis of human tracing in a CAD package, possibly assisted by an automatic line detection algorithm. The example data set here is relatively small, consisting of only 1/4 billion points. The multiple laser stations have been registered in advance of the processing performed here. The data is supplied in the simplest of text only formats, namely the PTX format. It contains position, estimated colour and return strength of each laser scan return. The following 3D preview of the points shows every 1/20 point. 
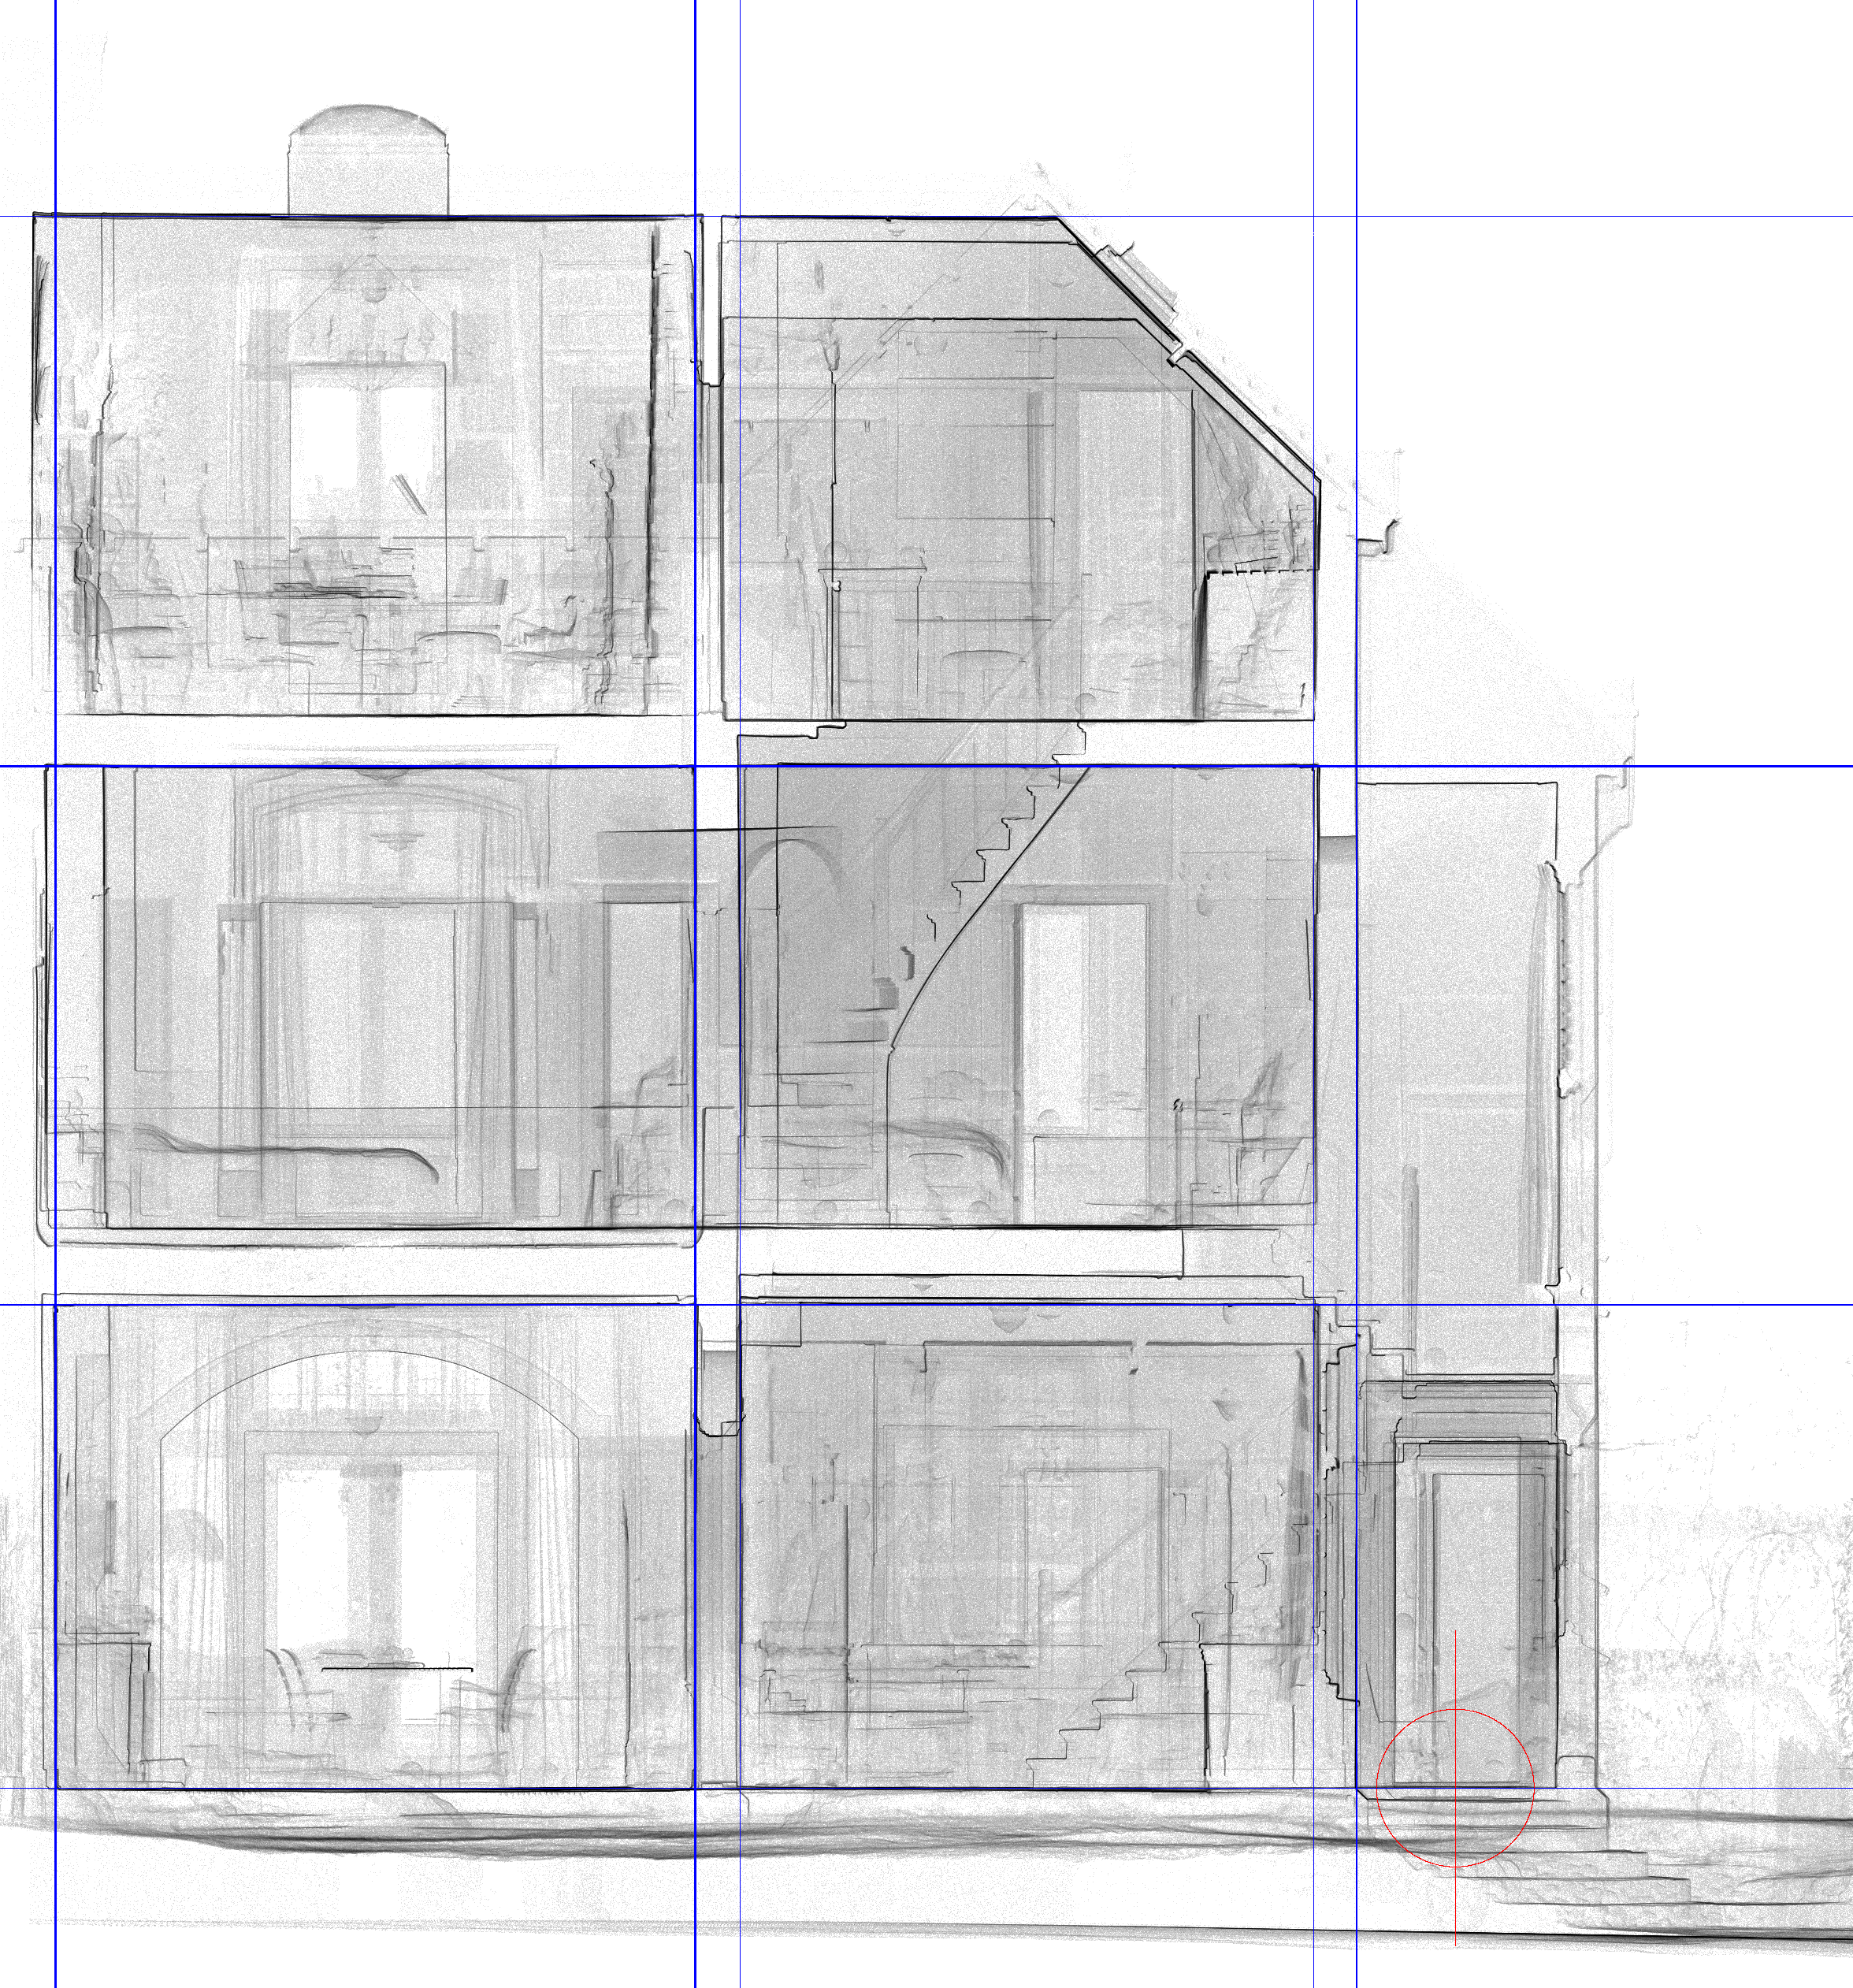
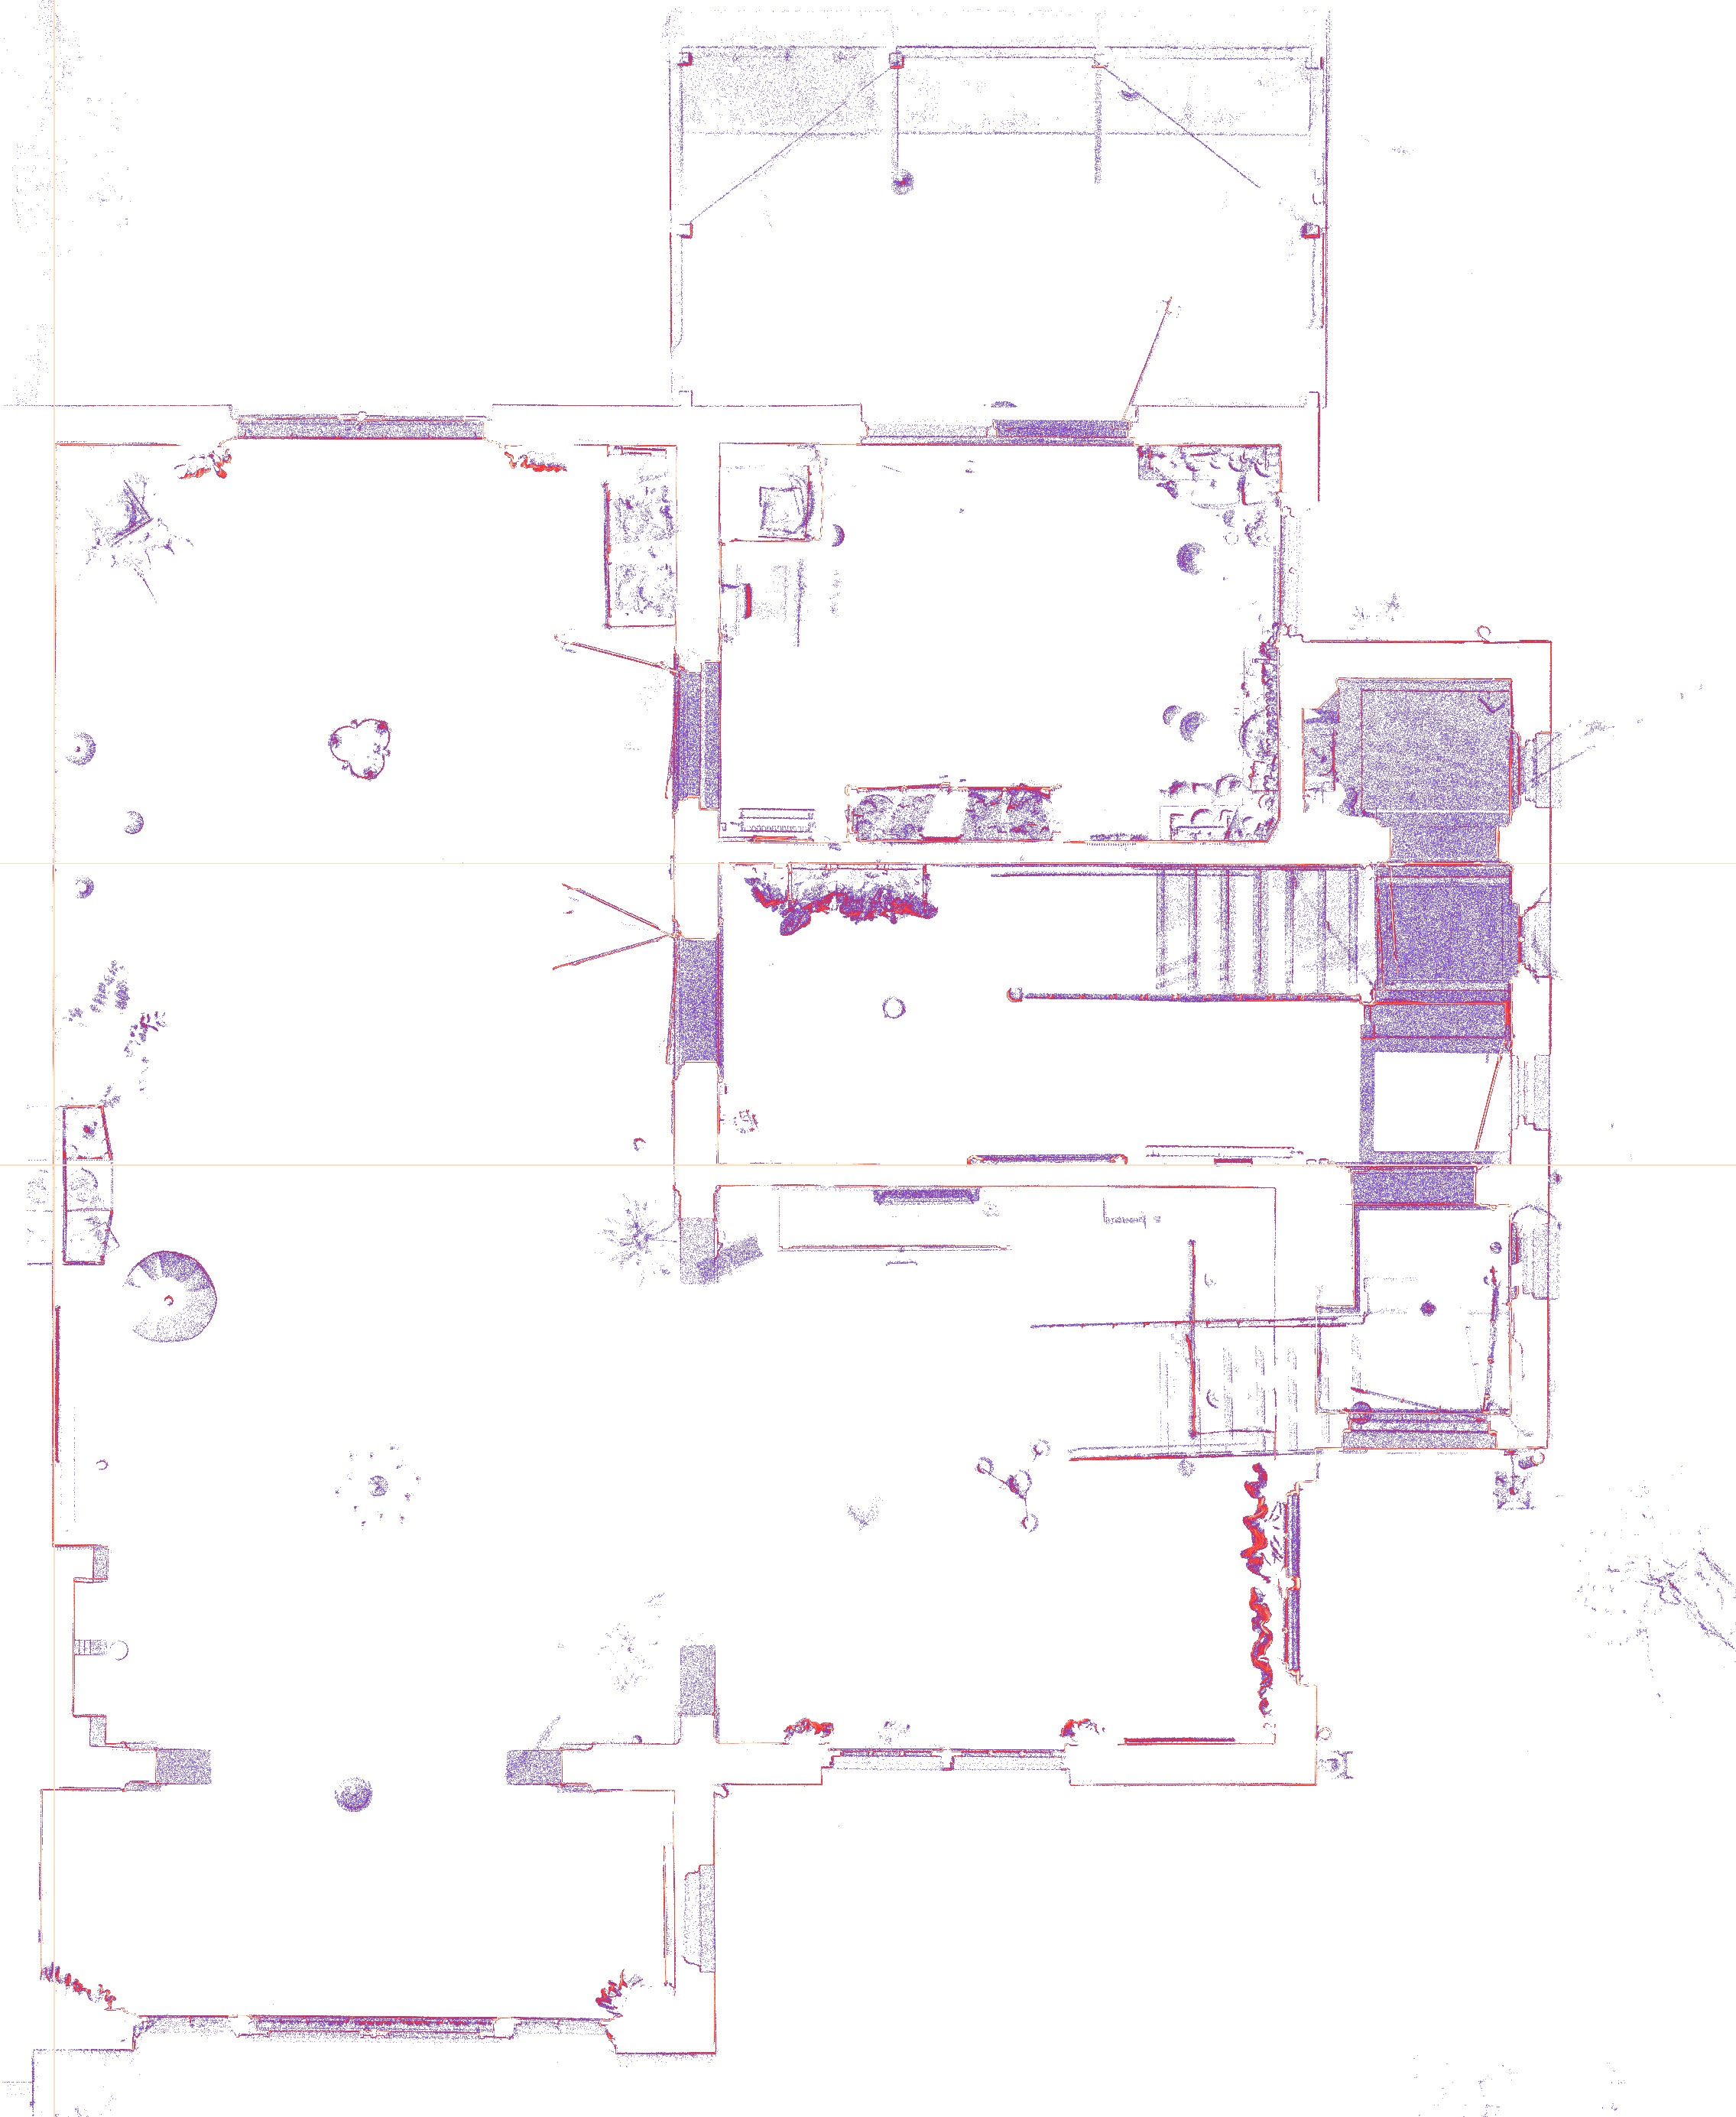
The key to an effective image representation is not to form a discrete sampling on the image plane but rather a 2D histogram of point density. That is, as points are projected into the desired plane they accumulate, this histogram is then mapped to a greyscale image. Objects in the scanned scene essentially get weighted by their importance perpendicular to the plane they are mapped onto. In the following all the points are mapped onto the x-y plane. The blue lines are automatic detection of strong line structure. 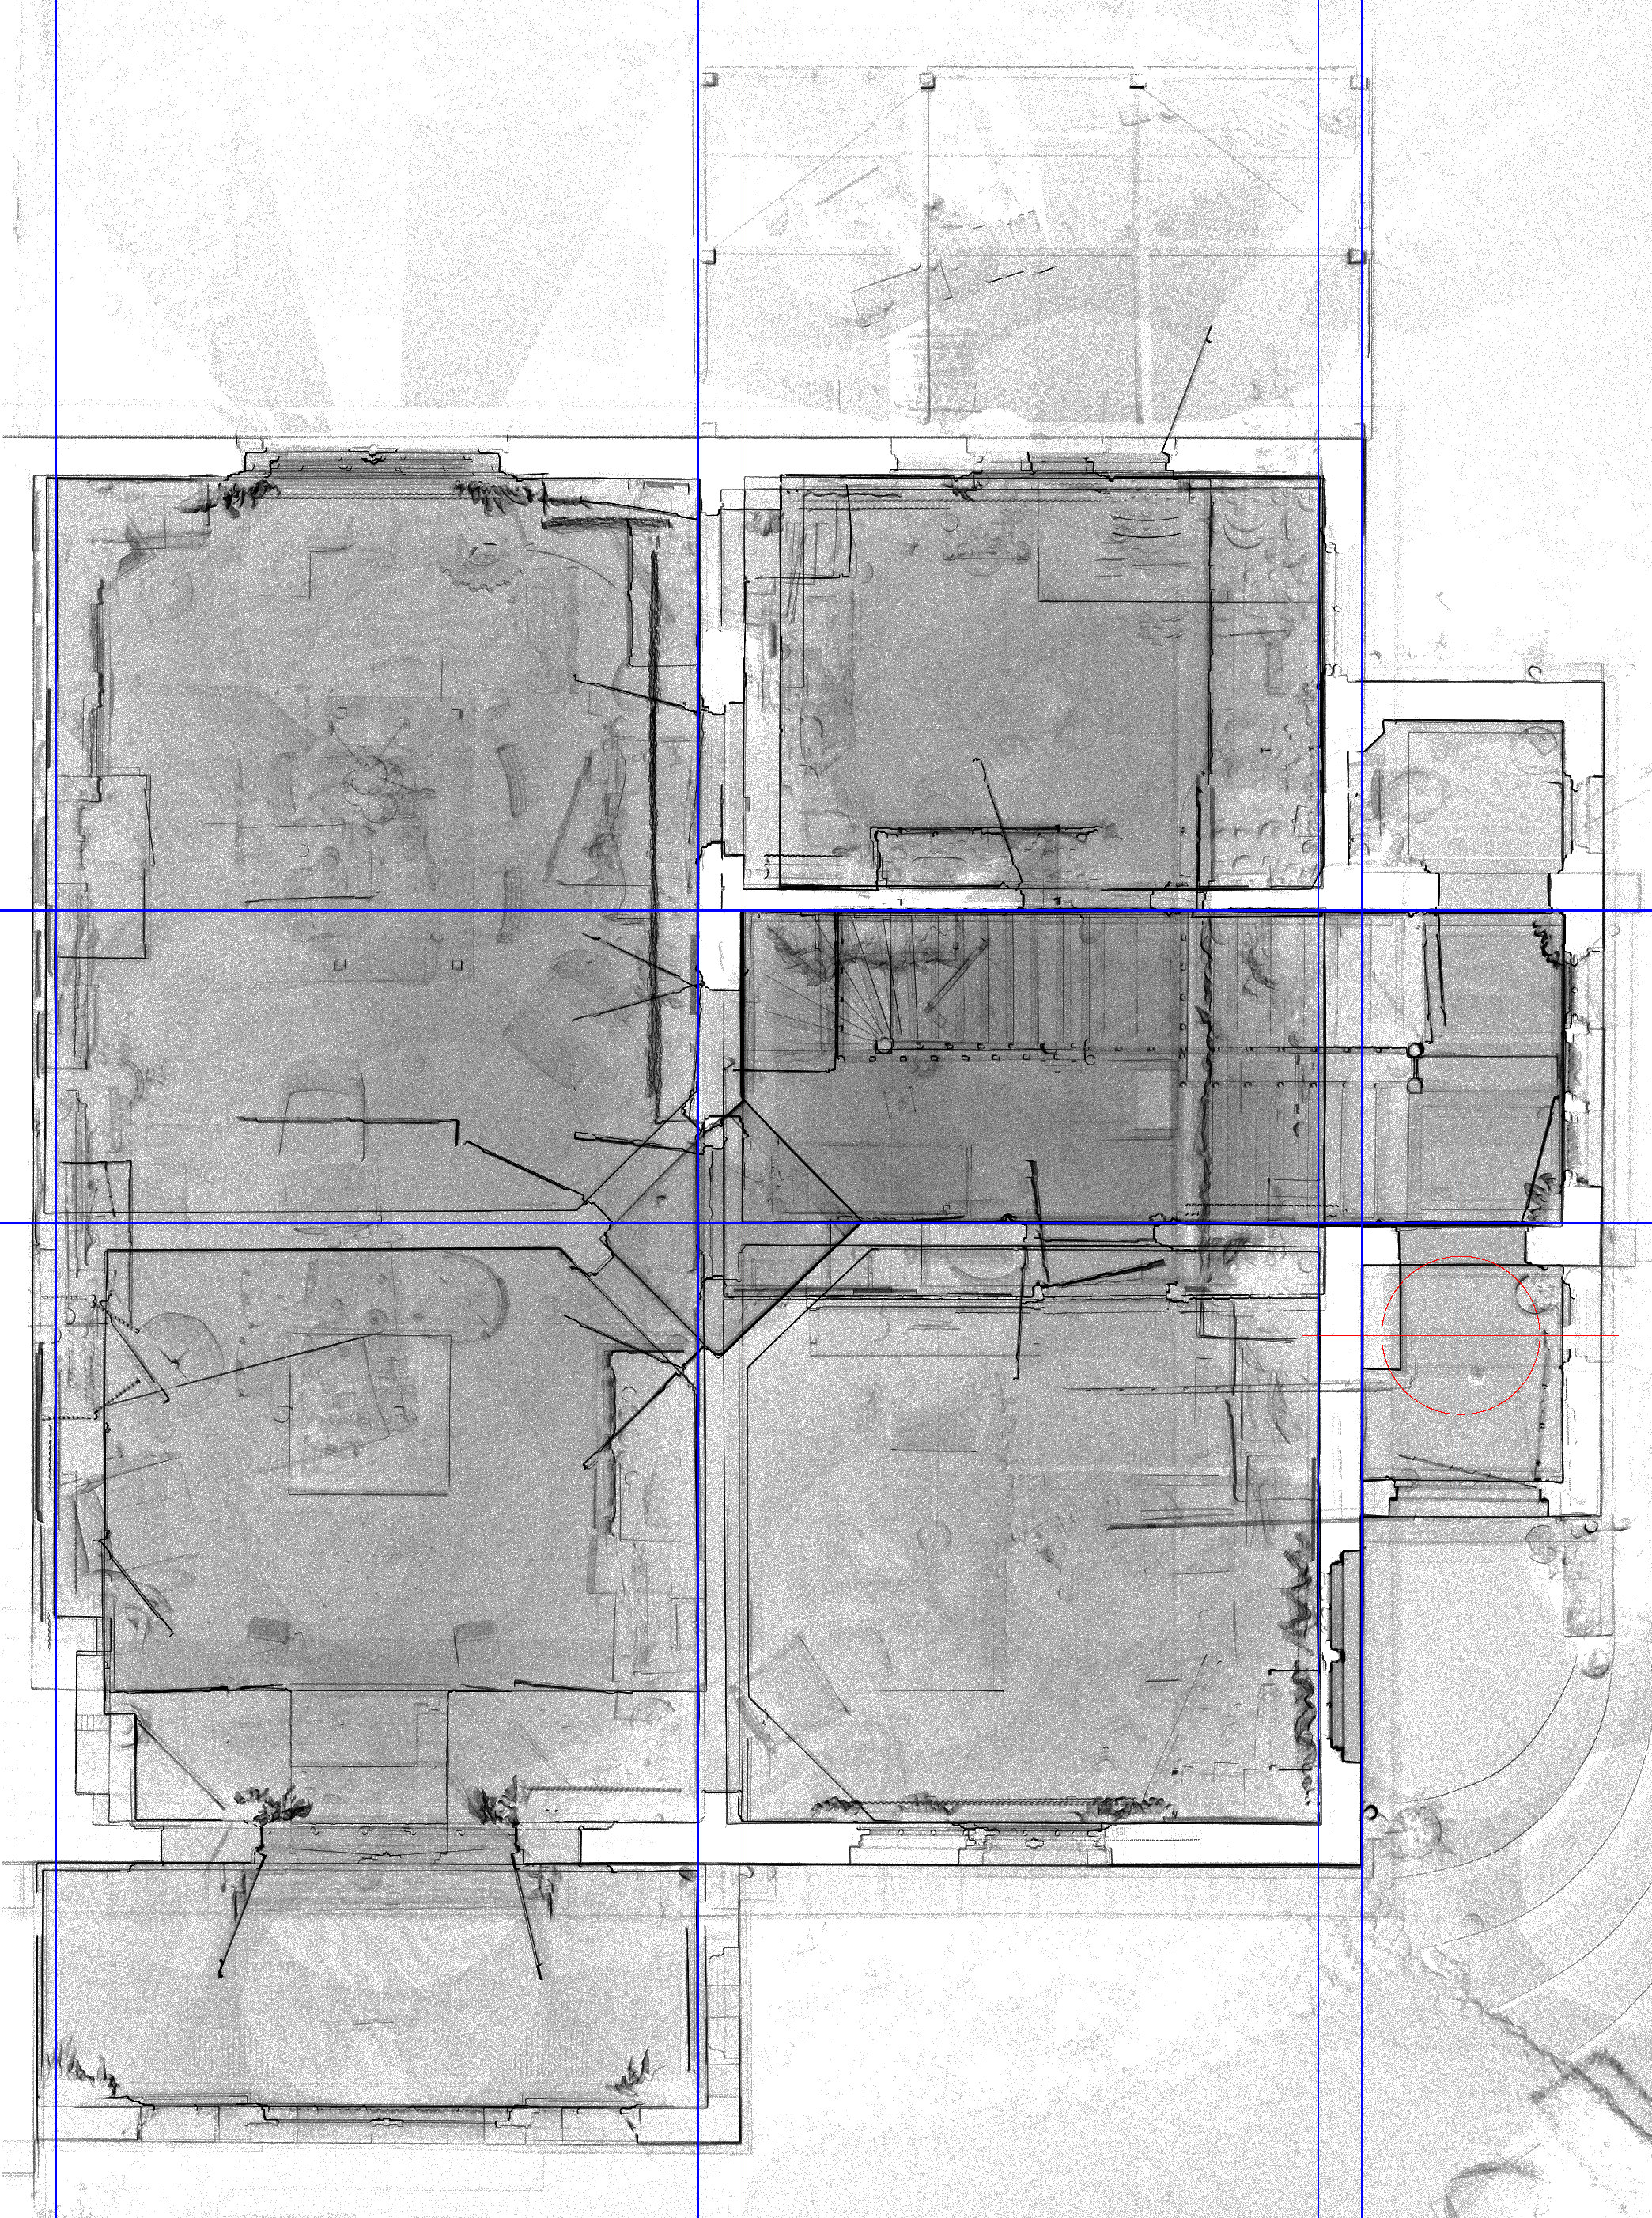
The laser scan data is of course in real world units, these are mapped onto a known image coordinate system by specifying the size of each pixel. In all the examples here 1 pixel corresponds to 5mm. In general there will be a desirable range of pixel sizes, too small and the laser scan points will overlap less and the resulting image will be low dynamic range, too large and the resulting image will be a low resolution representation of the laser scan data. 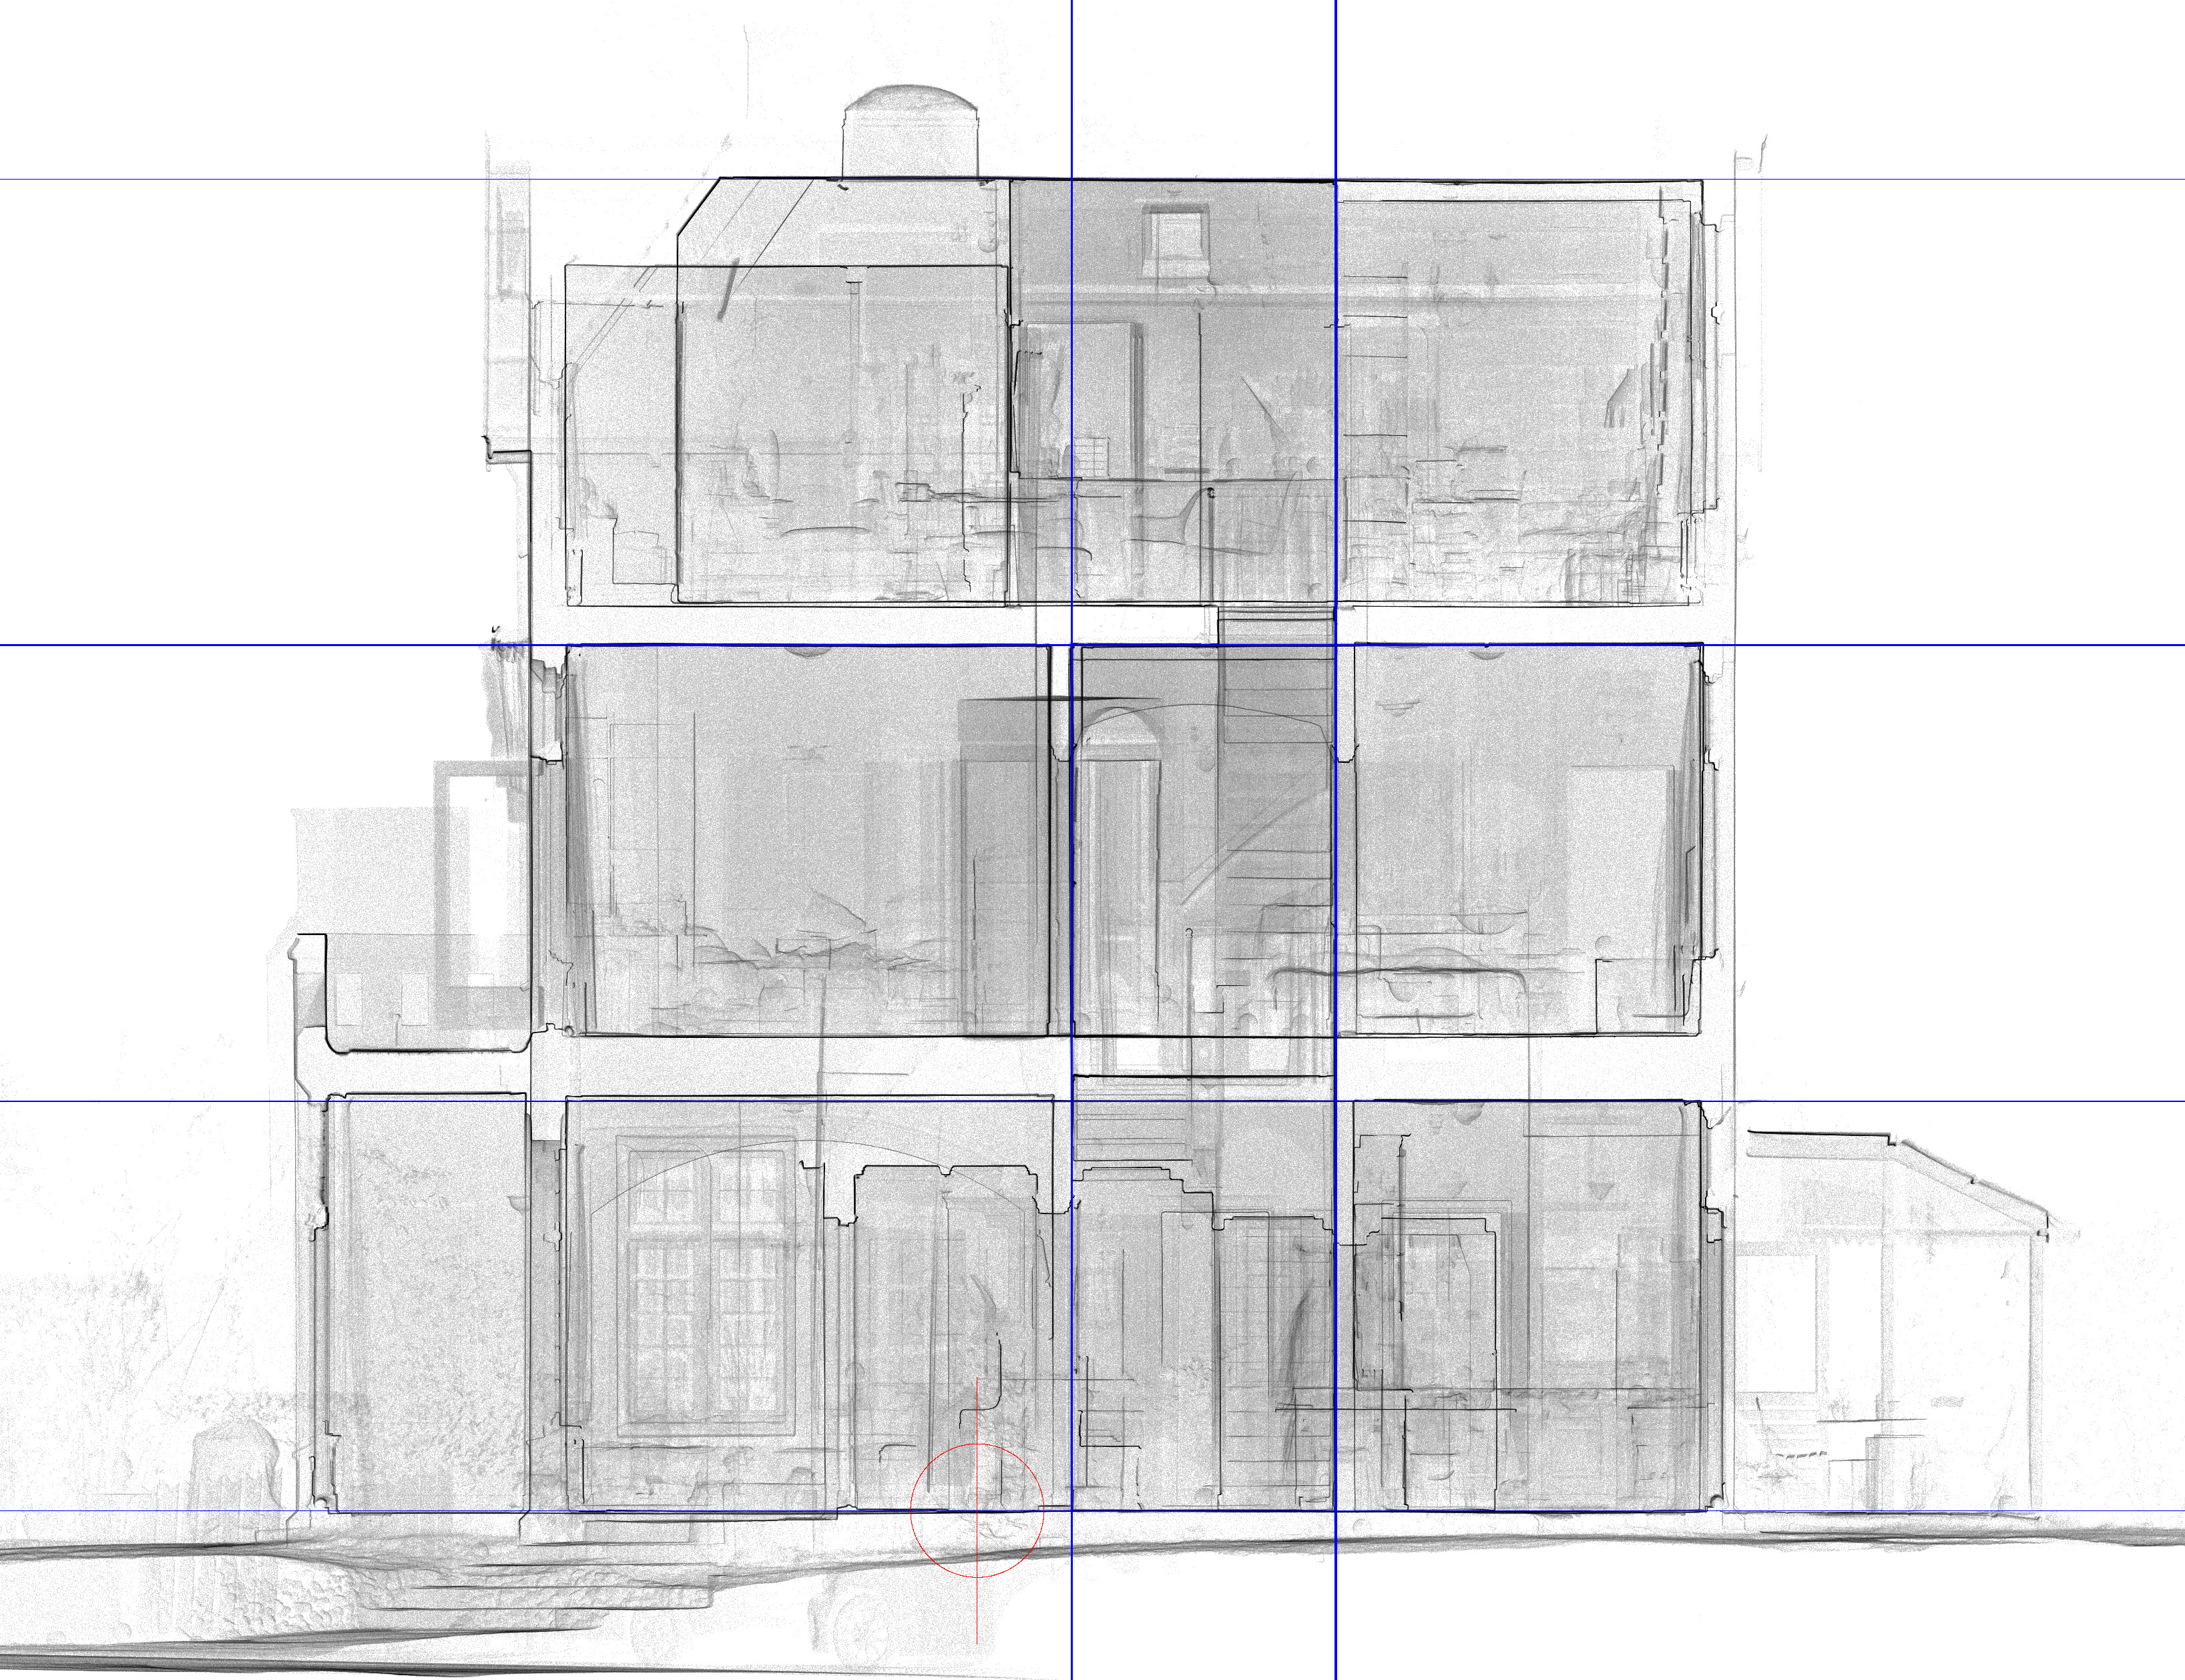
Instead of collapsing the entire height range, one can filter by a range of heights to get individual floor plans. The following is an example of height from 1.5m to 2.5m. 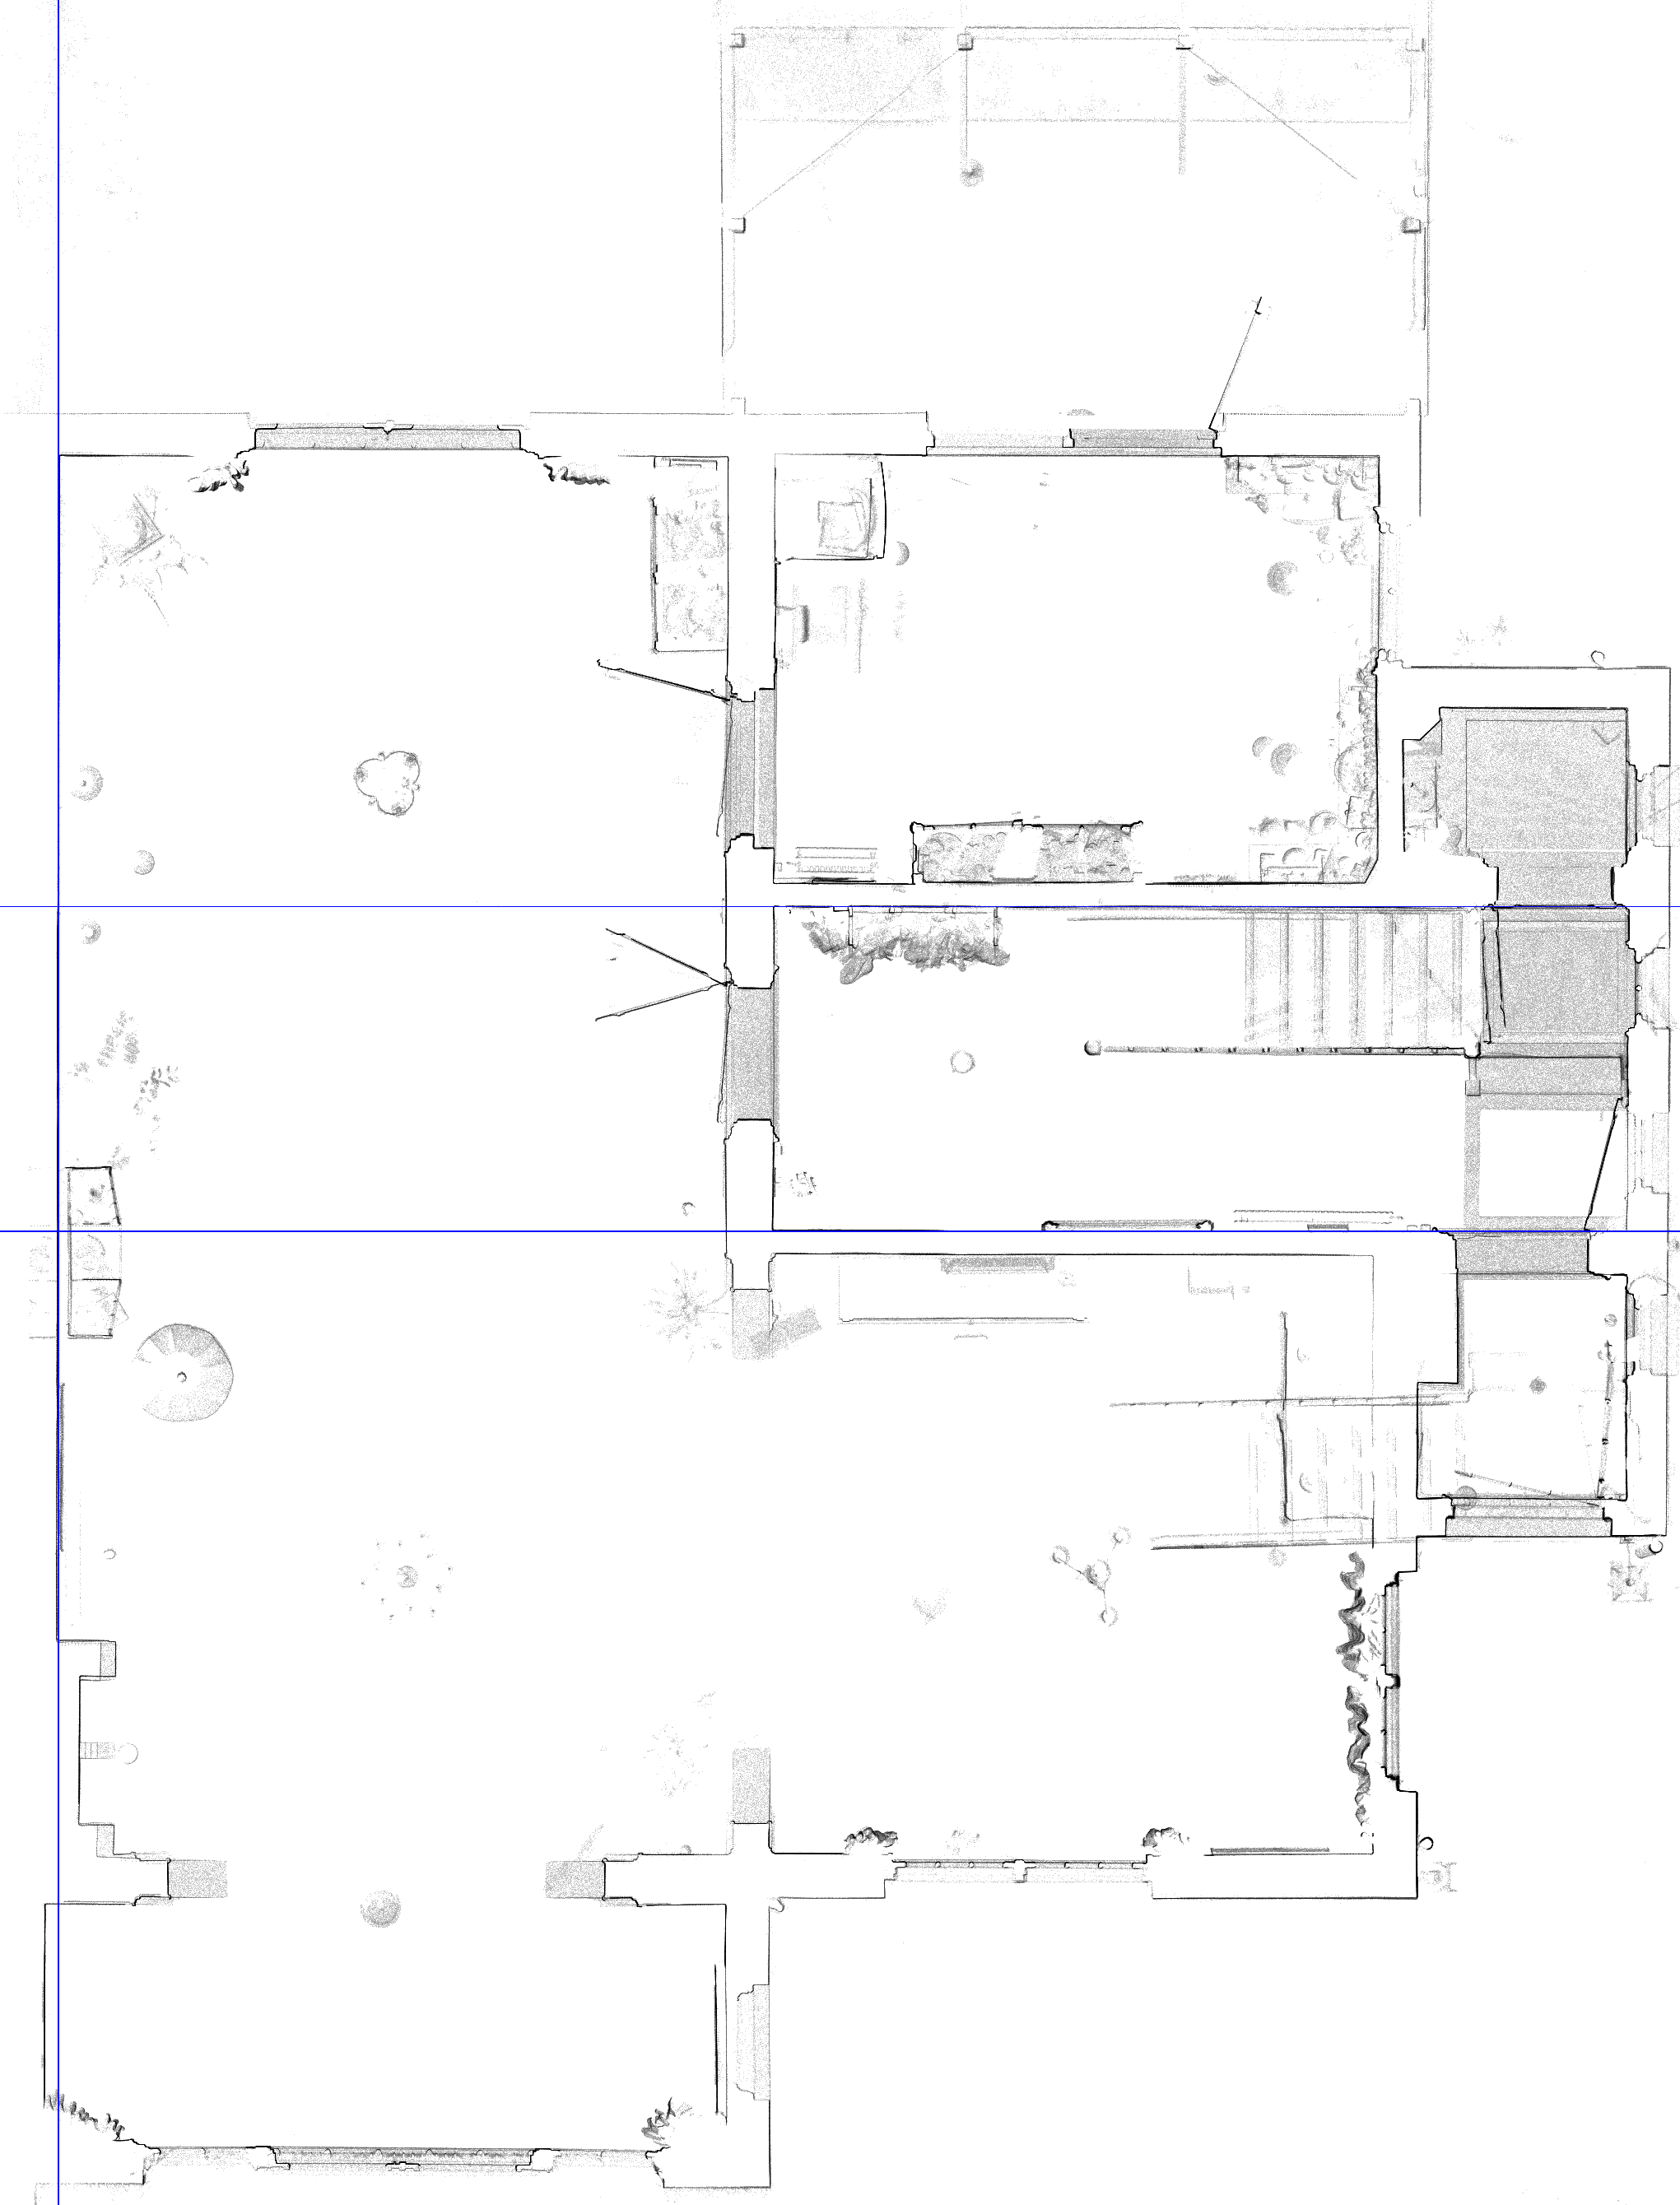
The following is from 0 to 1m so excludes floors but includes some furniture. 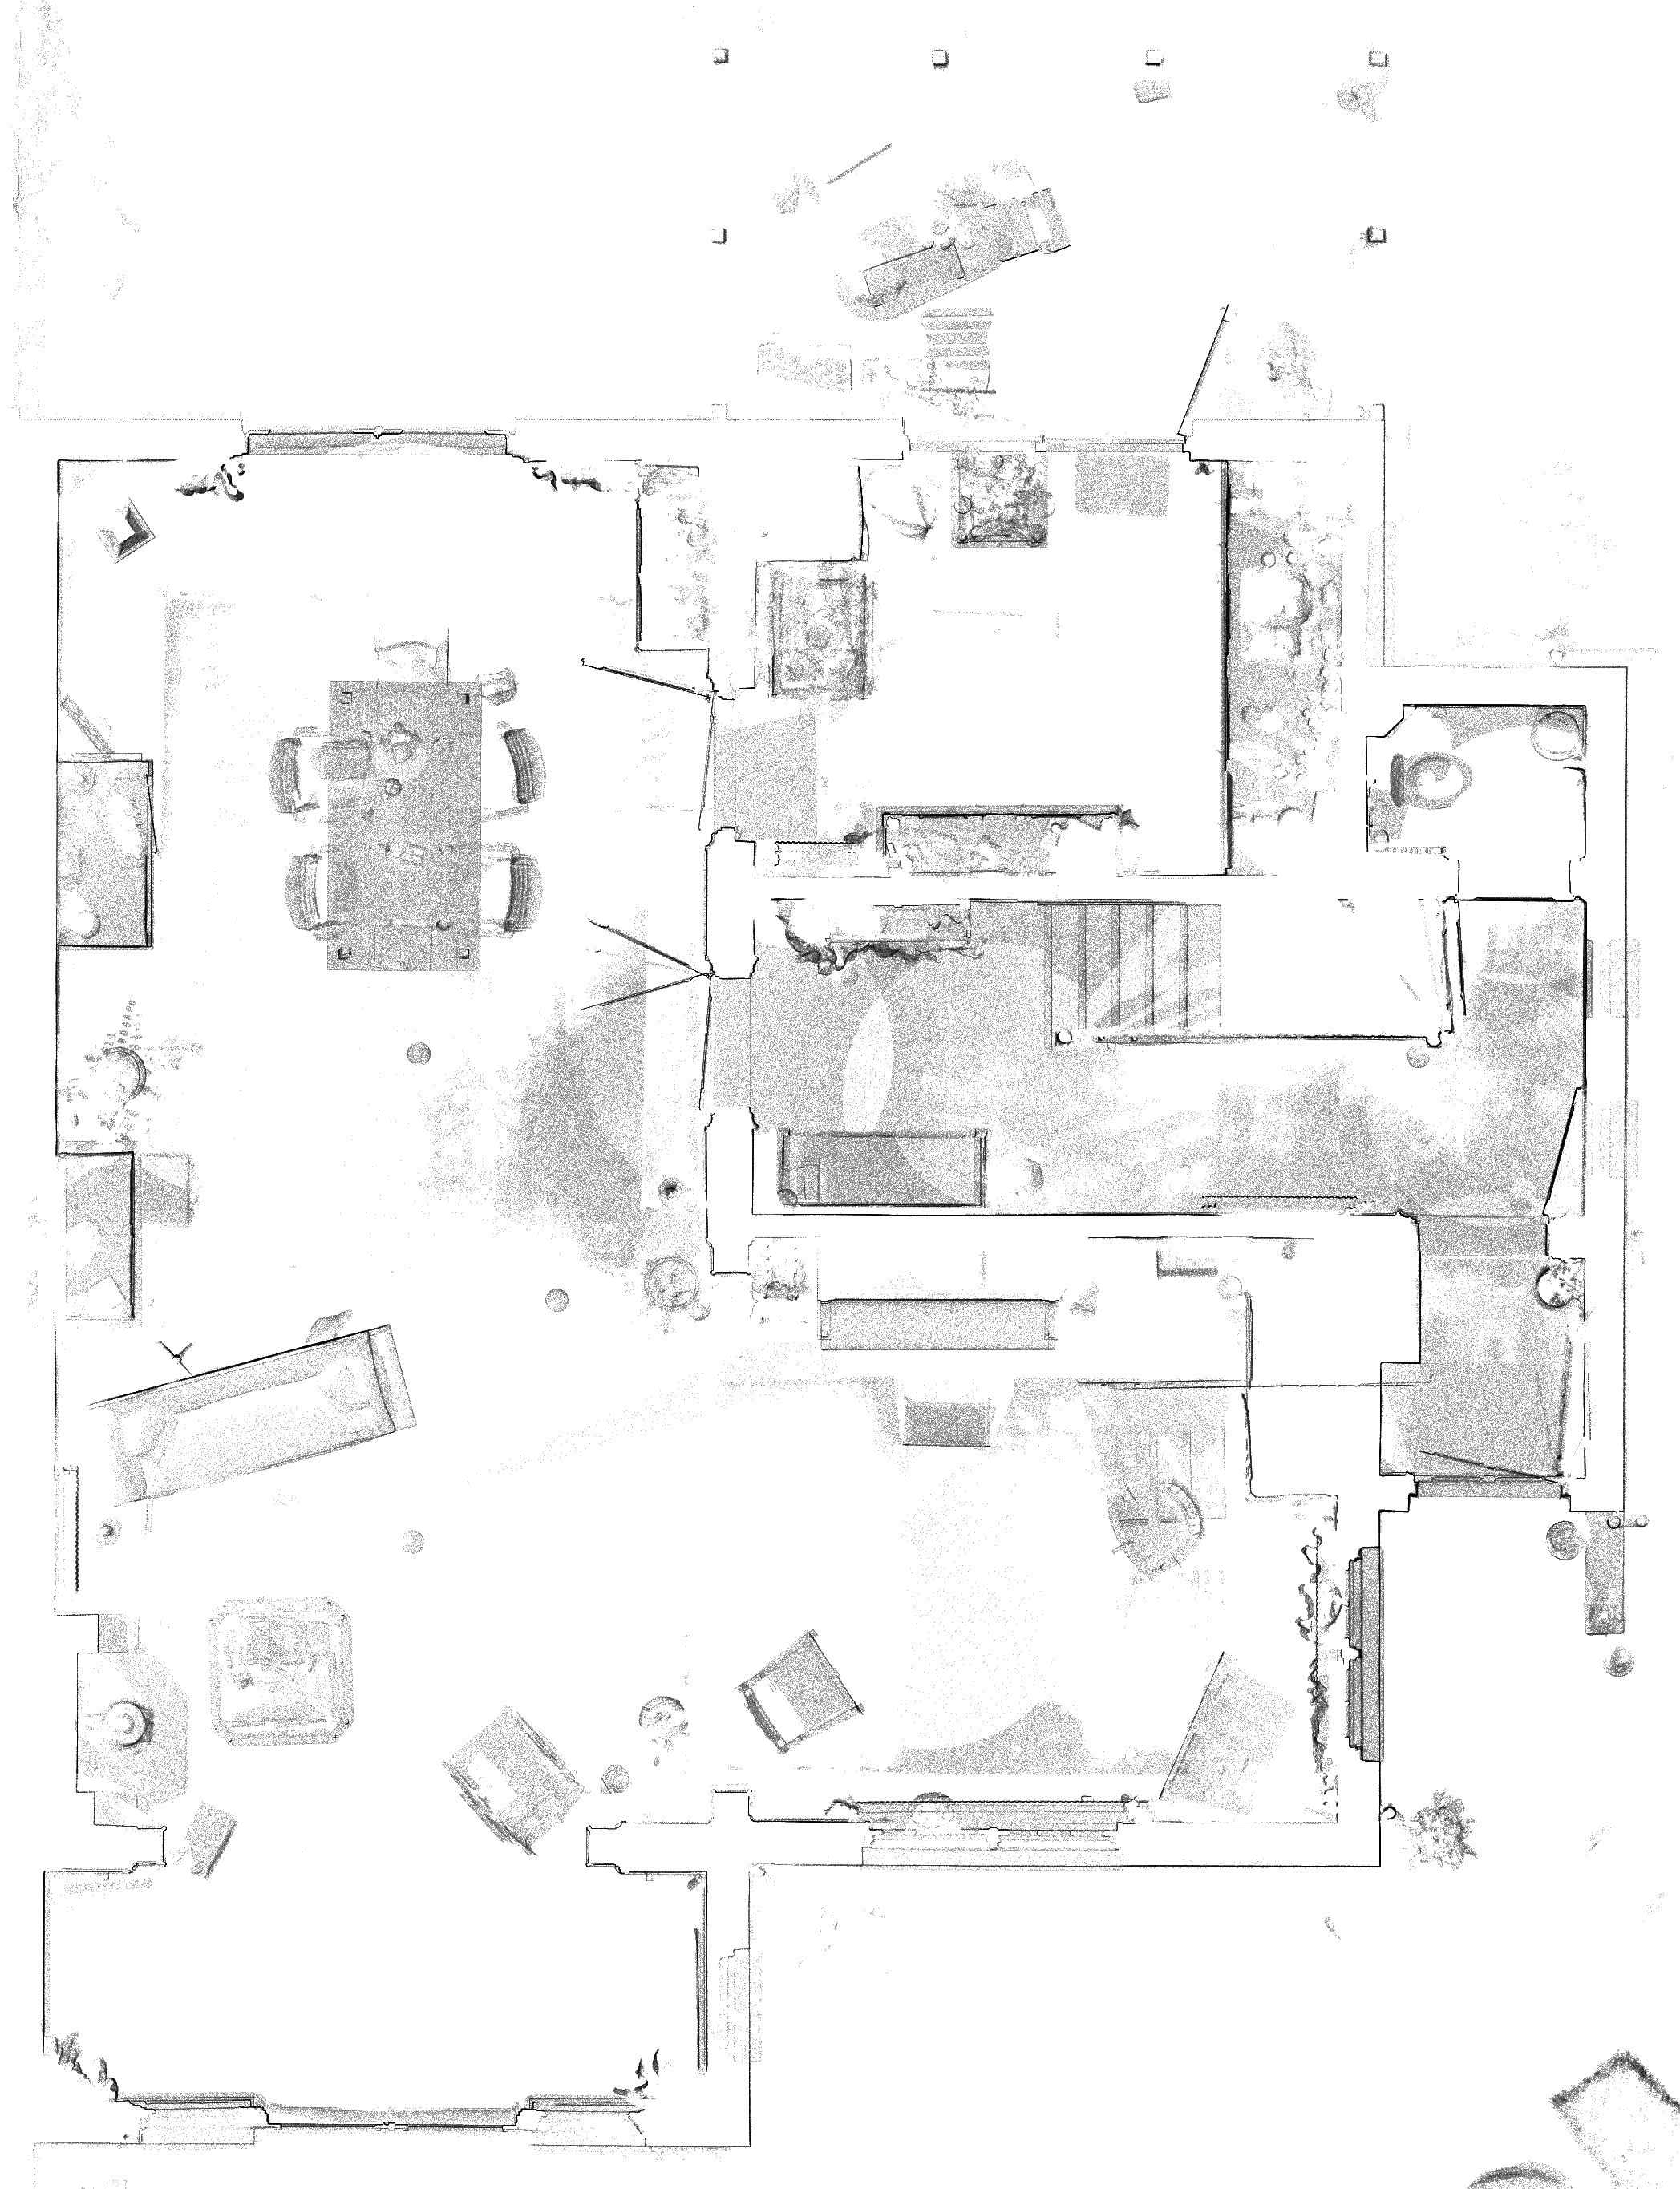
The histogram density can be used to form a colour map that further highlights the walls (tend to be denser) over the furniture and other features that occupy less of the height range.
Isometric view with histogram density colour mapping. 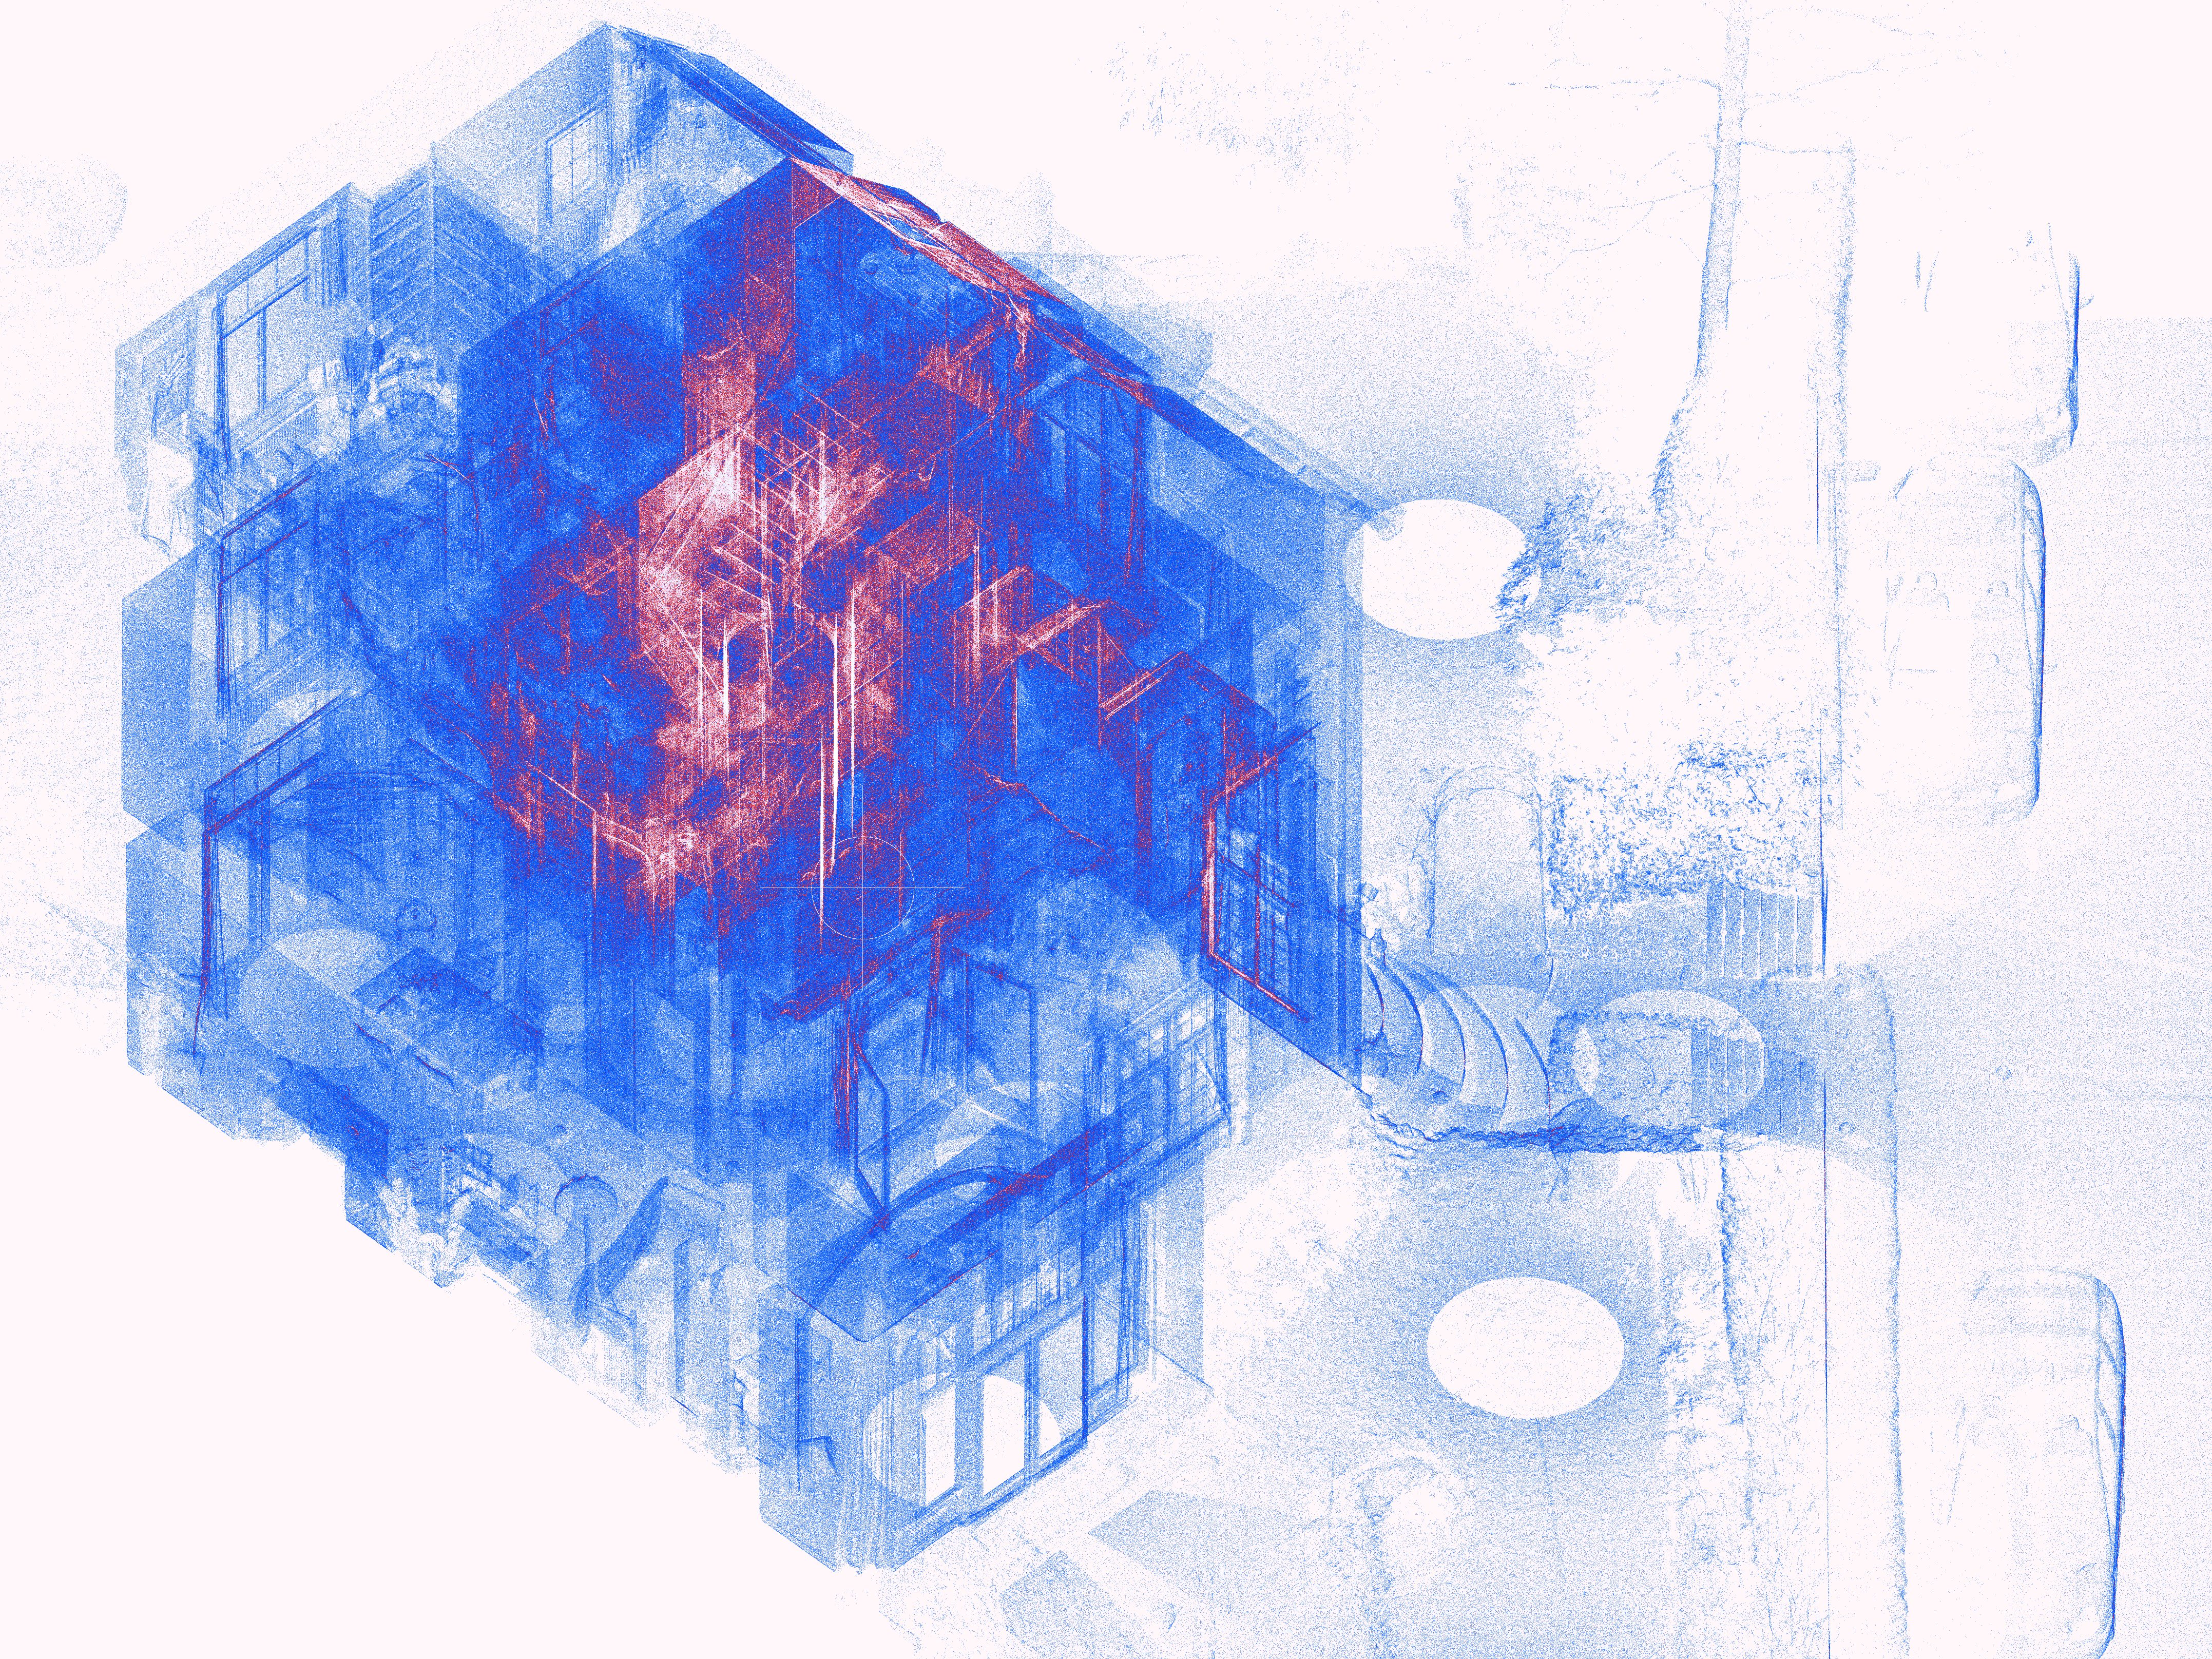
|