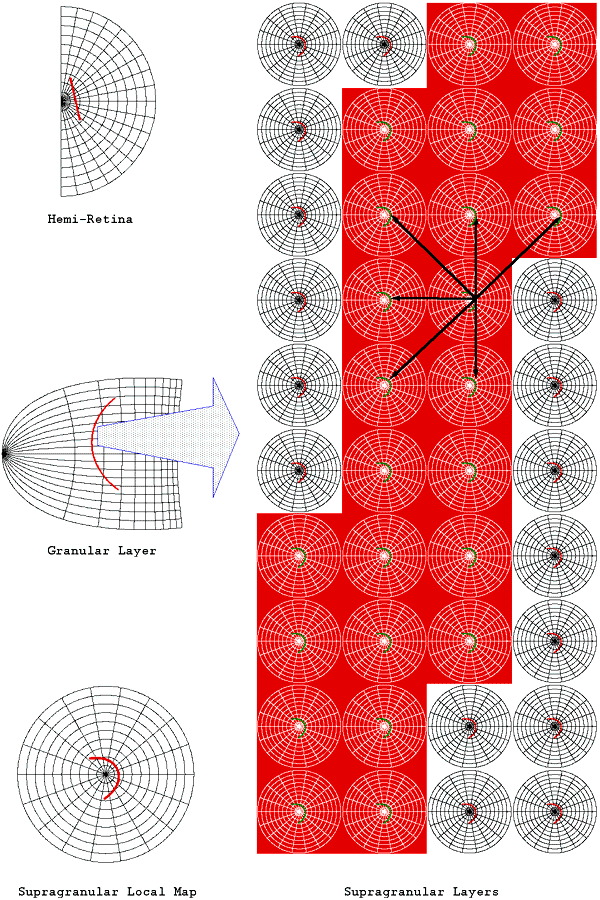
Schematic representation of the formation of intrinsic patchy connectivity. A short, oriented line (shown in red) is mapped according to the LGS model of V1. The left hand column shows the mapping from hemi-retina to the granular and supragranular layers. Right of figure shows a magnified section of the line in the supragranular layers and the intersecting local maps. Each point/orientation conjunction uniquely defines the line by position and angle. Patchy connectivity forms between pairs of the point/orientation conjunctions, through a hebbian learning rule (shown by black arrows).