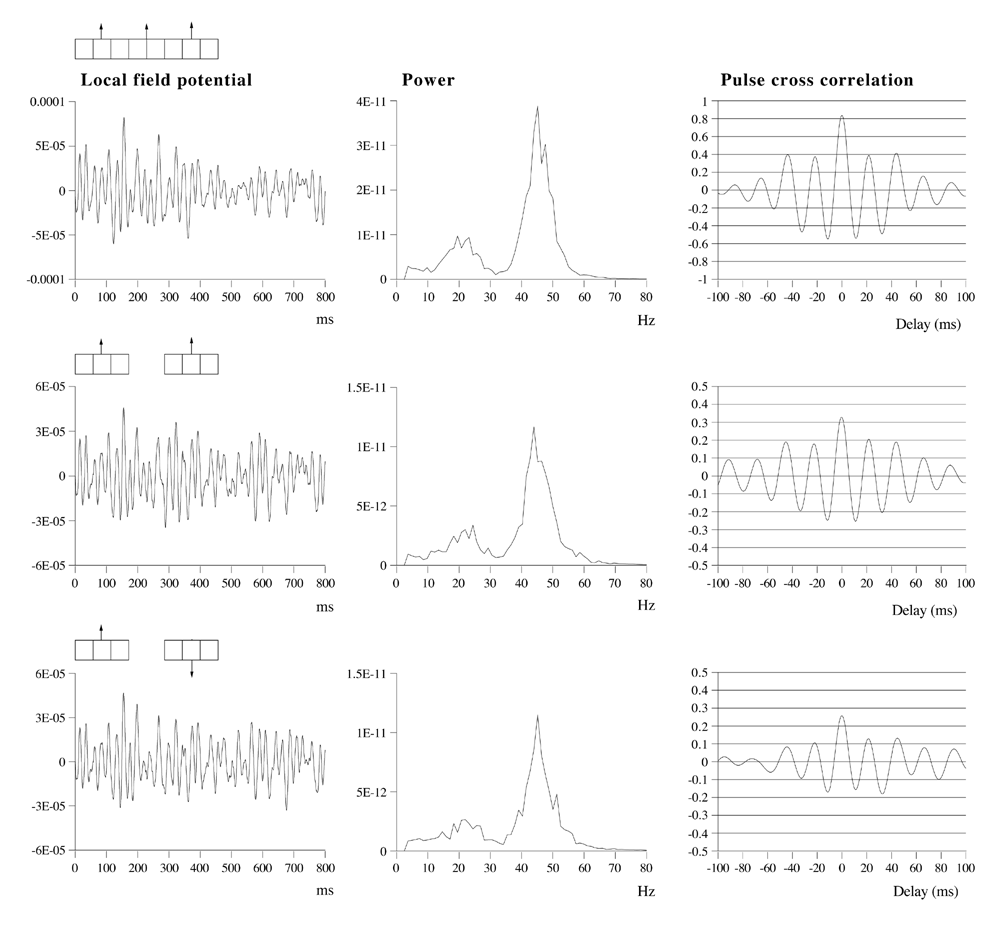
Figure 3a
Effects of stimulus extension and coherence on
synchronous oscillation.
Oscillations of local field potential (left hand figures), spectral power
(middle figures) and pulse-density cross-correlations (right hand figures)
in the simulated cortical field, as zero-mean inputs are swept across the
field in imitation of the visual stimuli associated with moving bars. A
single bar has coherent white noise inputs applied at each portion of the
bar. Separate bars have no input signal correlations - see text for details.
Diffuse field noise amplitude 0.000033. Top graphs: two short bars moving in
the same direction. Middle graphs: two short bars moving in opposite
directions. Bottom graphs: one long bar moving across the field. In this
figure and in all following figures, cross-correlations were associated with
standard errors of approximately 0.005 +/- 0.001. Thus, visible differences
in cross-correlation are highly statistically significant.
|

