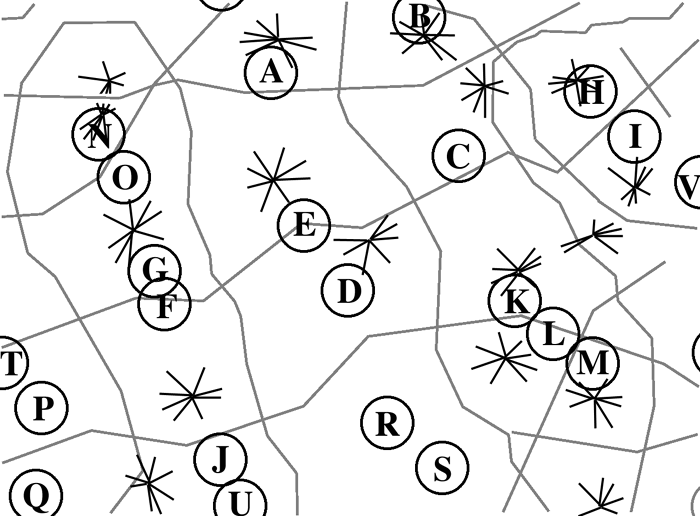
Figure 8c
Abstracted map of the tiling of response properties across the surface of V1. Circles mark CO blobs (or portions of elongated blobs), stars are singularities. Tile borders are defined largely by ocular dominance bands and reversals in the orientation preference gradient. See text for details of tile demarcation algorithm.
|

