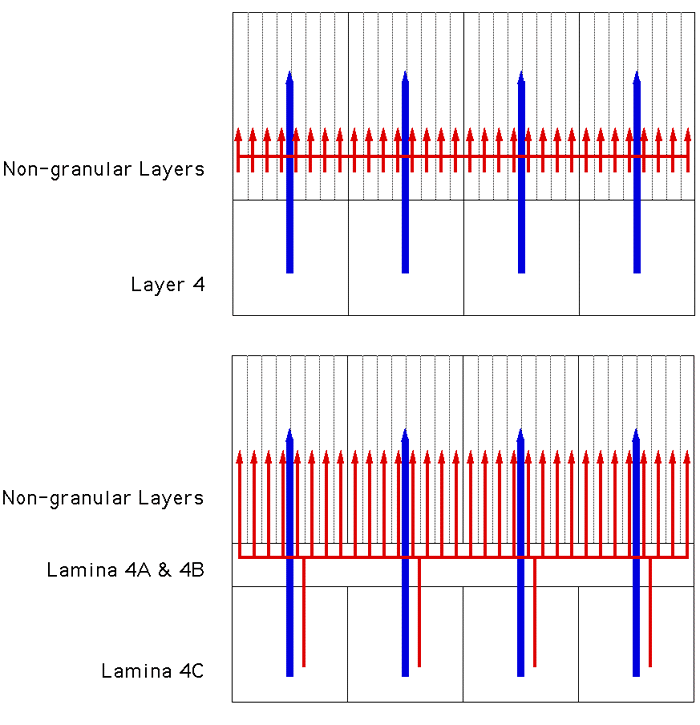
Figure 2
Hypothesized input connections used in the two versions of the model. The upper figure shows the inputs for the type I connectivity. Direct retinotopic projections are shown in blue. The indirect projections go from each minicolumn in the non-granular layers to every minicolumn in the non-granular layers, and are shown in red. The lower figure shows the inputs for type II connectivity. The indirect connections go from each retinotopic location in layer 4C, via laminae 4A and 4B to every minicolumn in the non-granular layers.
|