Visualizing Biological Data in 2012
Author(s): Kate Patterson (Garvan Institute) and Seán I. O'Donoghue (CSIRO & Garvan Institute)
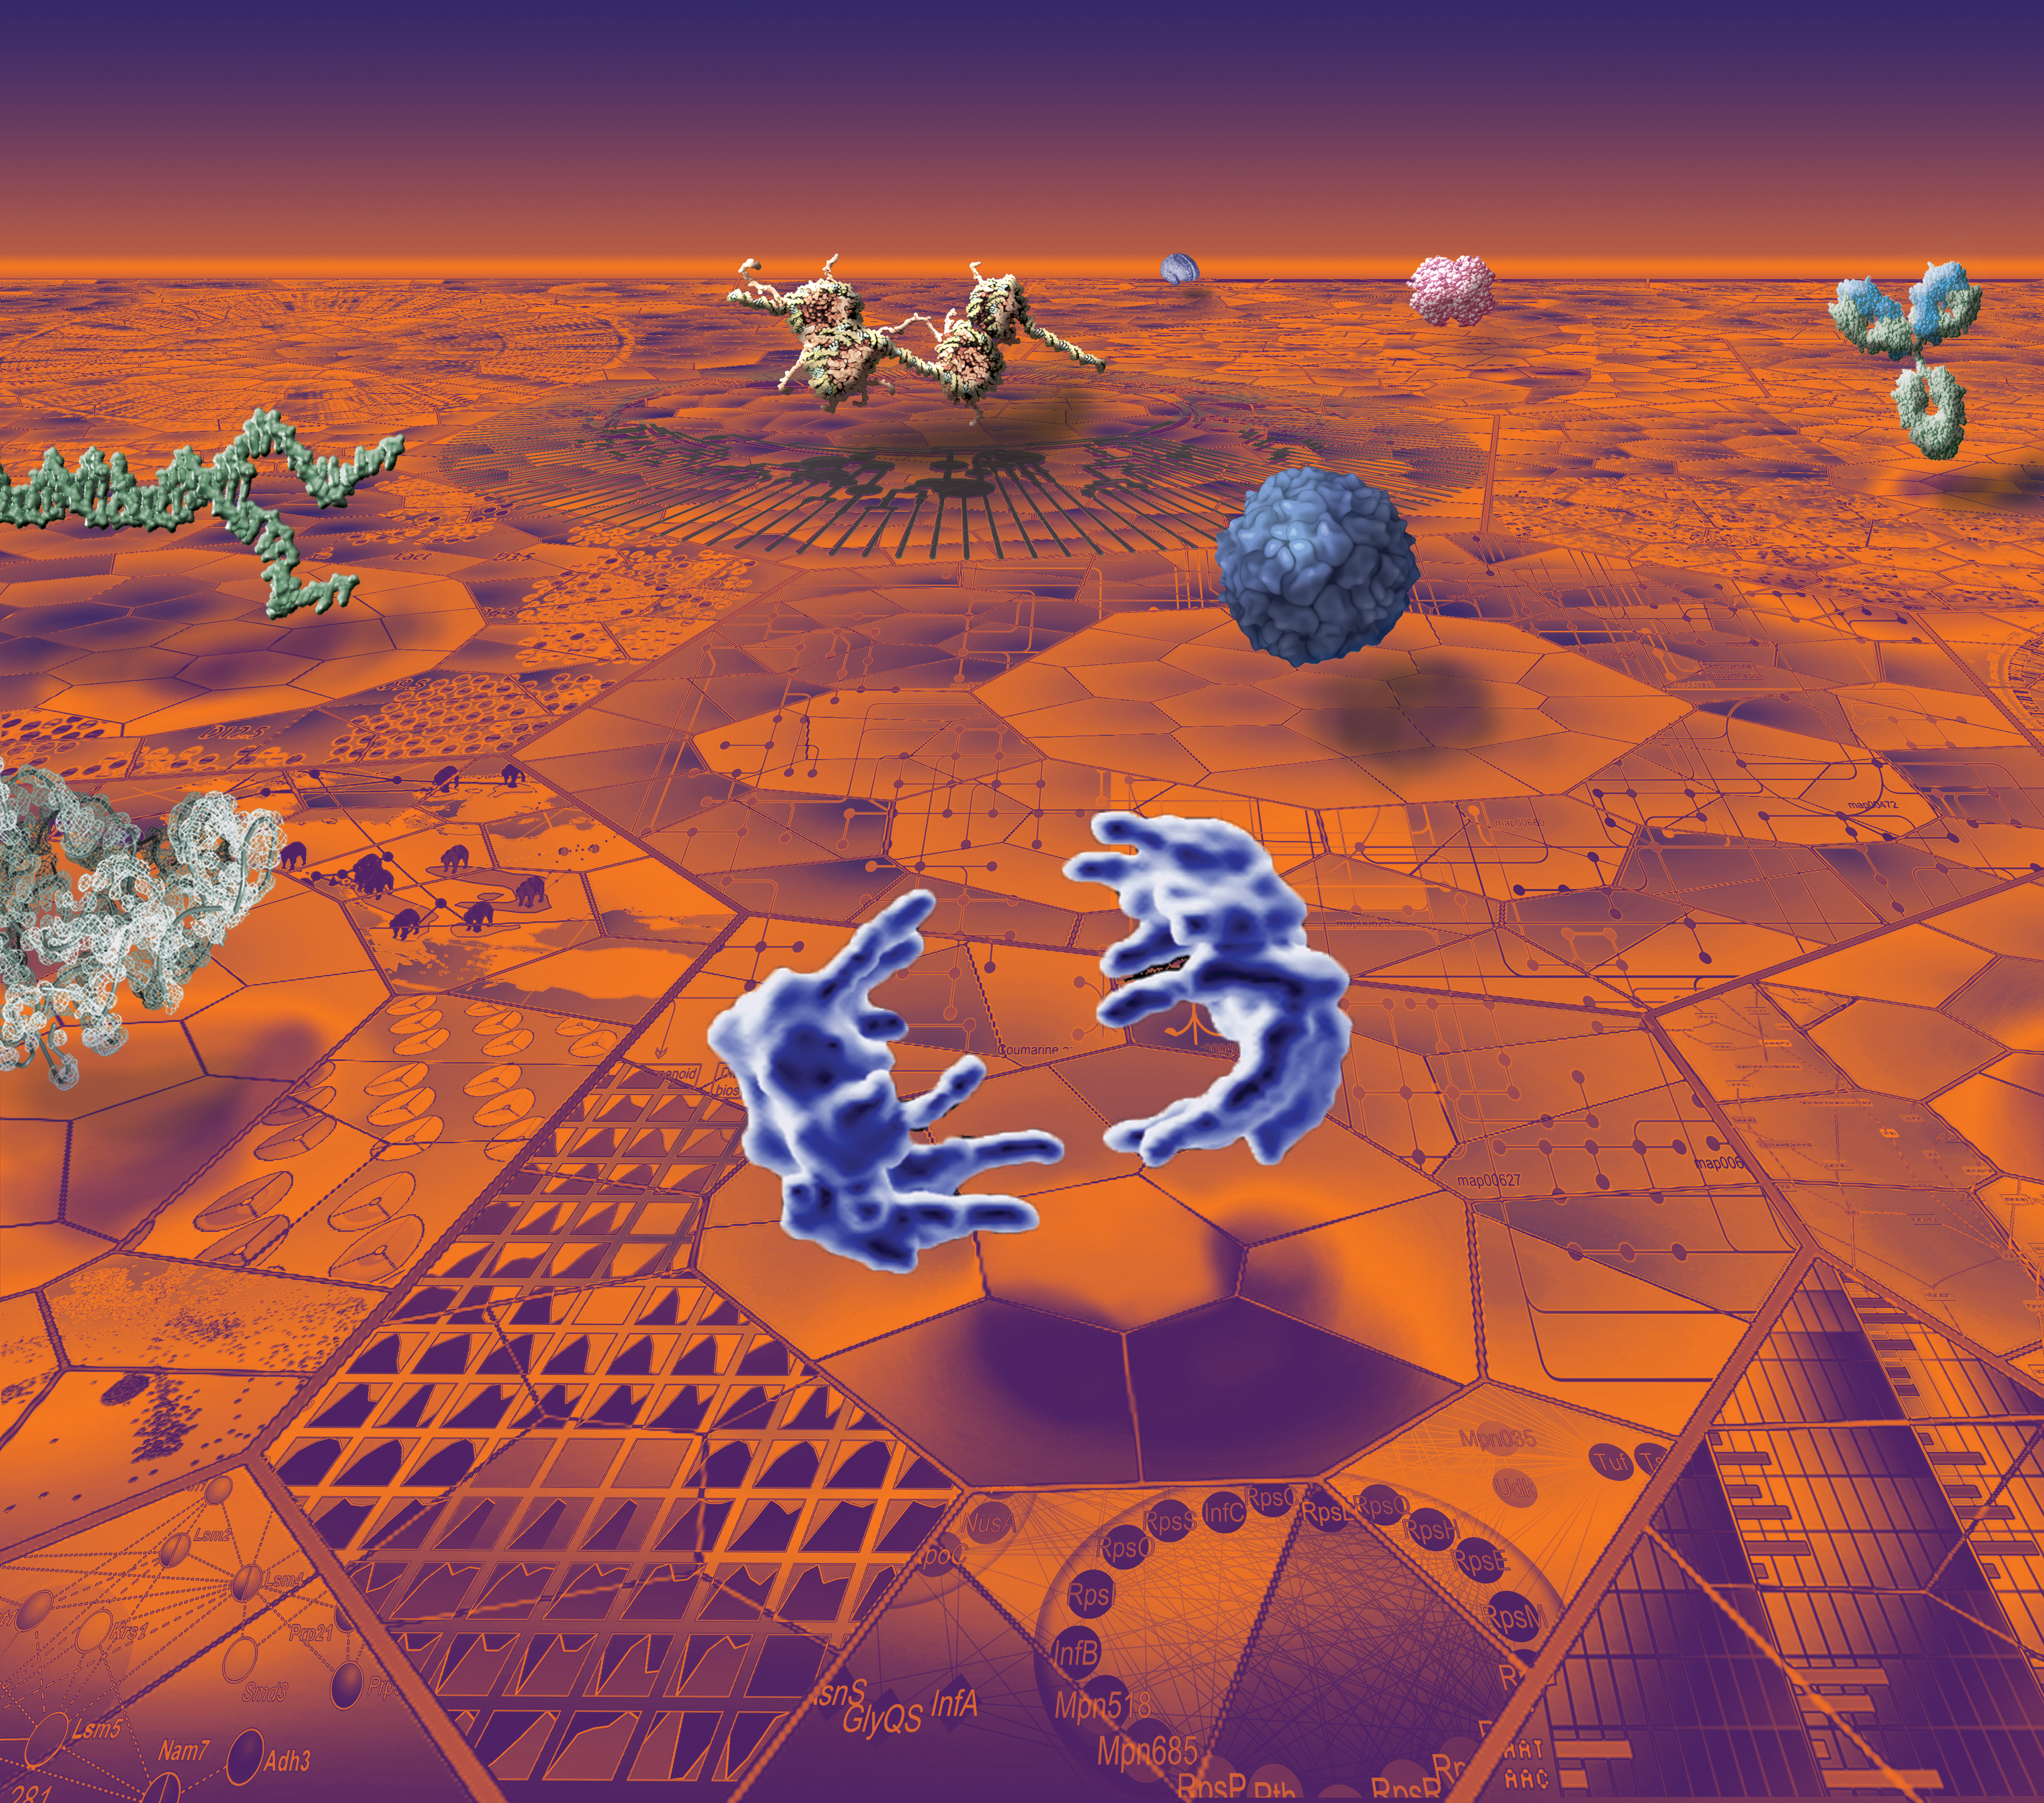
Description: The image is composed from a range of data visualizations currently used by biological researchers. The layout loosely follows a suggestion of the American designer Michael Beaton, and was originally inspired by a photograph of the '12 Apostles' from Peter Lik. The ground is made up of two-dimensional visualizations organized to fit within elements of the 2D Voronoi map from Jörg Bernhardt's 'OntologyMaps'. The following three-dimensional visualizations are shown above the ground: in the middle, at the front shown in blue are separating chromosomes in late stage of cell division cycle, from Jan Ellenberg et al.; behind that also in blue is shown the HIV virus capsid structure from Art Olsen; behind that is shown in yellow a Chromatin complex by Etsuko Uno and Drew Berry. Front left shows a crystal structure of RNA from Anne Pyle, Navtej Toor, & Kevin Keating; behind that in green are shown separating DNA strands. On the far right is shown a blue/green immunoglobulin antibody molecule from David Goodsell; behind that a typical globular protein structure also from David Goodsell; behind that, in the far distance, is shown a brain structure derived from MRI by Paul Thompson.
|