Visualising the UniverseS. Gill, C. Fluke, P.D. BourkeCentre for Astrophysics and Supercomputing, Swinburne University of Technology, PO Box 218, Hawthorn, VIC 3122, Australia 1 Introduction
They say that a picture is worth a thousands words: but what about an interactive virtual model of the Universe? Visualisation provides a host of new ways to learn about our Universe. As our understanding of the Universe grows, our ideas of what it actually looks like begin to take shape. Unfortunately we can not yet hop in the "Starship Enterprise" and visit Mars or another star system: at the moment we are restricted mainly to exploring the Universe from Earth with telescopes. To compensate for this, we take the journey into the world of computer simulation and Virtual Reality to simulate the space experience. Over the last eighteen months, the Swinburne Centre for Astrophysics and Supercomputing has visualised astronomical phenomena for a range of audiences at numerous forums: including the Swinburne Virtual Reality Theatre, Swinburne Astronomy Online courses and the Melbourne Planetarium at Scienceworks. The aims of the endeavour were manifold; ranging from enhancing the Centre's core research activities, to providing unique opportunities for public education on space and astronomy in Australia. The computer visualisations are produced using a combination of commercial animation packages (primarily Softimage and Lightwave) and custom-written C/C++ applications incorporating the open source graphics library OpenGL[4]. We classify visualisations into two broad categories: interactive and photorealistic. OpenGL provides geometric primitives (points, line and polygons) and various other techniques (such as "texture mapping" and lighting) to produce worlds that can be explored interactively. The commercial animation packages add a more realistic touch, but at the cost of interactivity. 2 Visualisation in Context
In order to gain an appreciation for some of the problems and benefits associated with visualising the Universe, we will consider two projects that the Centre has been involved in recently. 2.1 "A Flight Through the Universe"
The work of an international collaboration, the 2dF Galaxy Redshift Survey (2dFGRS) is the largest of its kind to date: with the goal of measuring the three-dimensional positions of a quarter of a million galaxies [1]. The purpose of this ongoing survey is to further our understanding of the large scale structure and evolution of the Universe, the mass of the universe; and provide limits on the fundamental cosmological parameters. The computer animation project "A Flight Through the Universe" (see Figure 1) was commissioned by the Anglo-Australian Observatory (AAO) in order to publicise a key milestone in the 2dFGRS, the 100,000th galaxy position. 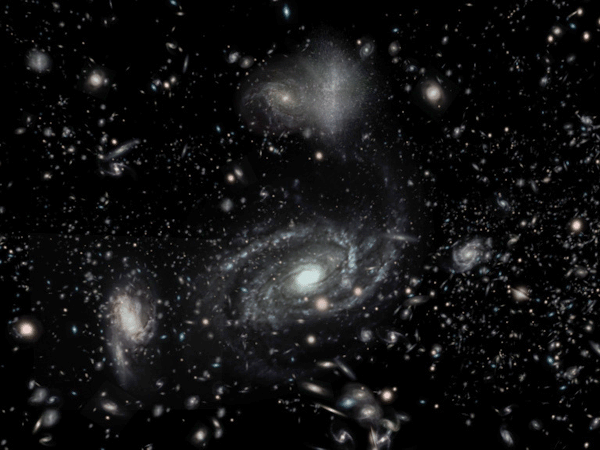 FIGURE 1. A scene from "A Flight Through the Universe". The AAO desired a realistic fly-through of their 2dFGRS dataset with which to promote this milestone at the American Astronomical Society AGM in July 2000. With the 2dF dataset, the Centre was able to produce the most scientifically accurate fly- through of our known Universe ever constructed out to distances of 4 billion light years, equating to a volume of space of about 13 billion billion cubic light years. 2.2 Just Add Water: "Terraforming Mars"
Motivated by the recent excitement over evidence for recent groundwater on Mars [2], in a project undertaken by Paul Bourke, a more "human friendly" Martian surface was reconstructed. The data for the reconstruction of Mars was provided by NASA from their Mars Orbiter Laser Altimeter (MOLA), one of the key instruments of the Mars Global Surveyor [3]. The NASA dataset was converted to a simple polygon mesh, from which a wire-frame Martian surface was reconstructed (see Figure 2). By adding appropriate colour maps, light source and atmospheric effects, Mars was made habitable! 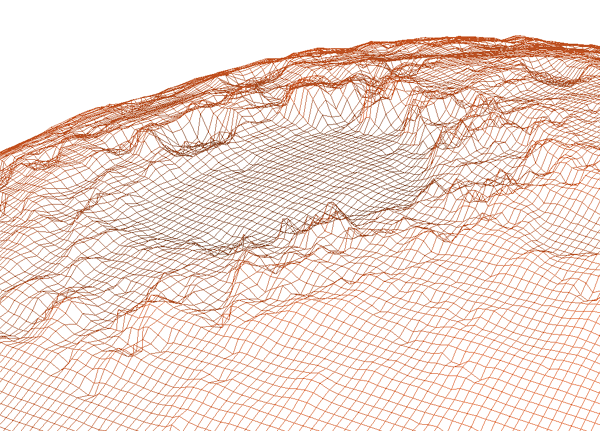 FIGURE 2. A piece of the wire mesh polygon model of Mars from the MOLA dataset. The ability to create these fictitious extrapolations is one of the exciting things that can be achieved with computer models and computational power. Parameters can be changed and modified as we see fit, allowing us to imagine what could have been or what could be. We will return to this in more detail later. 3 Probing the Case Studies
Many challenges have been encountered whilst trying to visualise our Universe. In this section, we discuss briefly some of these challenges, but also some of the unique opportunities that the tools of visualisation provide. 3.1 No Wonder its Called Space...
Space. To many people it is one of the most interesting and awe inspiring places ever contemplated, but the reality is quite different. In fact, it is called space because there is a lot of just that - space! One of the most difficult aspects of visualising the Universe is the problem of all this empty space. This problem was evident in preparing "A Flight Through the Universe". The distance between individual galaxies is typically about 100 times (or more) larger than the size of an individual galaxy. Therefore, flying through a completely realistic simulation of the large-scale structure of the Universe would be a seemingly eternal journey through a collection of "dots". Although such a model would be more accurate, it would not quite have the visual impact that was required for the project. Consequently the size of individual galaxies was exaggerated by two orders of magnitude to enhance the aesthetics, which had the added benefit of making some subtle aspects of large-scale structure (such as the existence of groups and clusters of galaxies) more obvious. It is interesting to note that the ratio of size of individual stars to their average separation within our Galaxy is many orders of magnitude greater than the ratio for individual galaxies within the Universe. A realistic flight through our Galaxy would make a journey through a "dot" Universe look positively exciting! 3.2 All it Takes is Time
Strongly related to the dilemma of distance is the problem of time. In the real Universe, there is a very definite maximum speed we can travel: the speed of light (300,000 km/sec). A simple space probe flight through our Solar System is a serious endeavour, taking months to reach the nearest planets. We are still a long way, technologically, from sending missions to the stars on a "useful" time scale (for example, the Voyager probes will take tens of thousands of years to reach the nearest stars). Once we step beyond our own Galaxy, the problem clearly gets much worse. Even if we had the technology to do it, to "simply" travel across a supercluster (a cluster is gravitationally bound collection of many hundreds of galaxies; a supercluster is a cluster of galaxy clusters) at the speed of light would take in order of the Hubble Age of the Universe ( ~ 12 billion years). For "A Flight Through the Universe", we again had to trade-off the physically accurate for the visually interesting. Interpreting the simulation time as "real time" we travelled at velocities 1015 times the speed of light, which is quite impossible. Even with the most fanciful explanations, such as we are viewing a set of "time lapse" images, this journey could only have been undertaken in a virtual world. Further to this we must also appreciate that our everyday experiences are limited to relatively slow velocities. The velocities required to explore our Galaxy would actually change the way we perceive the Universe as relativistic effects begin to dominate (see Savage and Searle work [7] for a description of visualising relativistic effects). To realistically travel through our Universe we would be fighting relativity at every bend. 3.3 But What Does it Really Look Like?
Another fundamental problem in the visualisation of the Universe is our limited knowledge of what many astronomical objects look like at optical wavelengths. We gain an understanding about the physics of an object from all different wavelengths of the electromagnetic spectrum such as: radio, gamma and x-ray, however, for our visualisations we are mainly concerned with what we can see, that is the optical regime. Although we can present images of most of our Solar System quite well, our best high resolution optical images (e.g. Hubble Space Telescope) of Pluto and Charon are still quite inadequate. With obvious limitations on the resolution of our optical telescopes we are quite unaware of what many particular astronomical phenomena look like. This presents us with particularly fun problems as we infer and imagine from the physics what the astronomical objects could conceivably look like. One class of objects the Centre is particularly interested in is pulsars. A pulsar is a rapidly rotating neutron star, that is, a star made almost entirely of neutrons, that was formed after a very massive star ended its life as a supernova. Pulsars are surrounded by very strong dipolar magnetic fields which guides two highly focused beams of radiation from the poles of the star. As these beams sweep across the Earth's position (like a cosmic lighthouse), regular radio pulses are detected. No one has ever received a "close-up" view of a pulsar, but from our understanding of the physics involved, we can reconstruct a plausible model (see Figure 3). 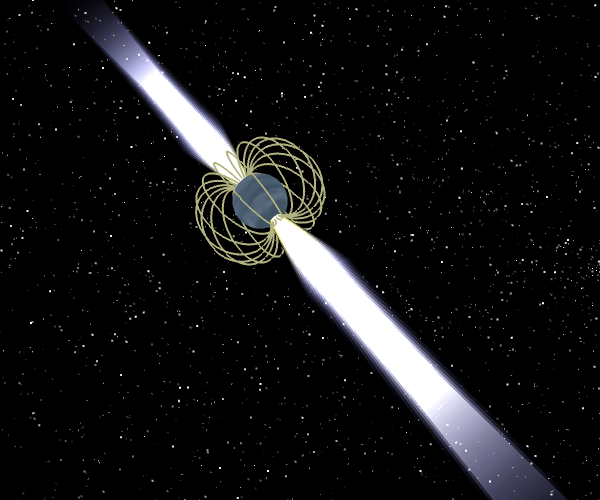 FIGURE 3. A recreation of a pulsar 3.4 Looking on the Bright Side
As mentioned earlier, one of the unique things we can do with computer models is to expand our ideas, to imagine other alterations and to show detail where we could not see it before. Exaggerating the perturbations in Mars's surface provided quite striking results showing quite clearly the diversity on the Martian surface, helping us better understand the topology of Mars. 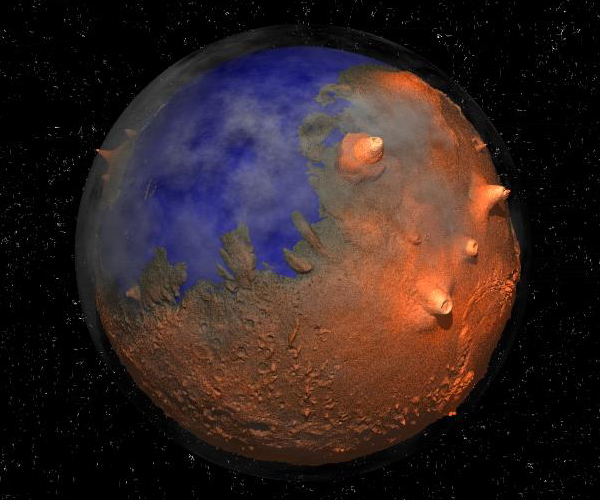 FIGURE 4. Terraforming the surface of Mars. 4 Visualisation in Action
There have been many opportunities for the Centre to present the Universe to the Australian public and to the world. 4.1 Astronomy Online
The Centre's Astronomy online course is an Internet based astronomy course that reaches students from around the world. An increasing number of astronomical visualisation have been placed into the course. 4.2 Let's Get Virtual: AstroTour
Virtual Reality (VR) has been around since 1968 with the implementation of the first system by Ivan Sutherland [5]. However, it wasn't until the 1980s that VR captured the imagination of the popular press. Unfortunately, with the expense attached to many VR devices, slow progress has been made with applications of VR. There are many different types of VR. For our purpose, however, it is defined to be a self contained 3D world which the user can move around in and interact with. The emphasis of the Centre's VR work has been on stereoscopic 3D, which simulates the human experience. In the 3D world, two computer "cameras" are used to simulate our eyes, so that two separate views of each scene are calculated. With the aid of a pair of shutter glasses, these images are viewed as left-eye image with left-eye only and right-eye image by the right-eye only. This provides a sensation of depth and results in a more realistic VR experience. The Centre's director, Professor Matthew Bailes, was attracted to VR by the potential to visualise scientific datasets in an attempt to further understand the underlying physics. With this objective in mind the Swinburne group developed an affordable VR alternative, with the creation of the Virtual Reality theatre during 1999. Since then, the benefits of the VR theatre have been significant. Most notably, it provides a novel and exciting method with which we can feed the appetites of space- hungry Australians and communicate the wonders of the Cosmos. We are excited at Swinburne to see the launch of our Astro tours for school children as we seek to excite them to the possibilities of space as they are taken on a journey through a Virtual 3D Universe. (For more information on the Astro tours refer to reference [6]) 5 Conclusions
Visualisation of the Universe is no small task. It involves a great deal of physics and computational power mixed together with a healthy imagination. Some of the fundamental problems that plague visualisation also plague space travel. The Universe is a large place and the laws of physics just make it that bit larger. A virtual Universe allows us to make the Universe as small as we like because we are able to bend the rules. The Centre's visualisations and Virtual Reality theatre provide a place to dream, and to generate excitement and desire in people to imagine "what if?". It is truly a powerful medium with which to educate but also to cast a vision and spark the next generation of explorers. For many people though, flying through a virtual Universe is not enough, but it is an exciting beginning. 6 Acknowledgements
Every visualisation the Centre undertakes seeks to represent the Universe as faithfully as possible, consequently we depend fundamentally of scientific data. Therefore, we would like to extend our thanks to Brian Boyle and David Malin from the AAO, Matthew Colless and the rest of the 2dFGRS team and NASA. References[1] Website for 2dFGRS, was http://www.aao.gov.au/2df/ [2] Malin, C. M., and Edgett, K. S., 2000. Evidence for Recent Groundwater Seepage and Runoff on Mars: Science, v. 288, p. 2330-2335. [3] NASA's MOLA Website: http://mpfwww.jpl.nasa.gov/ [4] Official OpenGL Website, was http://www.opengl.org [5] R. Pausch, D. Proffitt, G. Williams Conference paper for SIGGRAPH 97. [6] Website of Swinburne's Centre for Astrophysics and Supercomputing, was http://www.swin.edu.au/astronomy [7] Savage and Searle's Visualising Special Relativity.
|