Fourier Outline AnalysisWritten by Paul BourkeMarch 1995
Fourier outline analysis is used to describe the application of Fourier techniques to generally closed curves. The primary issue is that of "unwrapping" the outline in order to obtain a 1 dimensional discrete series that can be used by standard DFT (or FFT) routines. One common technique is to choose a point within the object of interest and radiate rays to the boundary for a range of angles. The length of the rays from the central point to the boundary as a function of the angle is stored as the series.
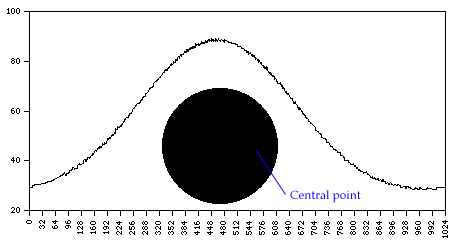
Example 1 - circle

The first thing to notice is the difference in the series
depending on the central point for the rays. For a circle, if
the central point was chosen at the centre of the circle then
the function would be a constant, namely the radius. As the
centre point moves towards the boundary the series increasingly
becomes a flattened periodic function.
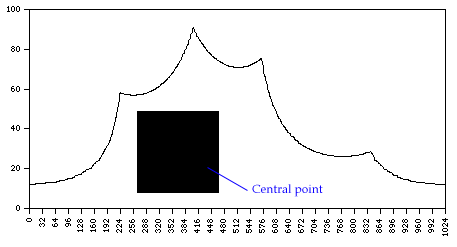
Example 2 - square

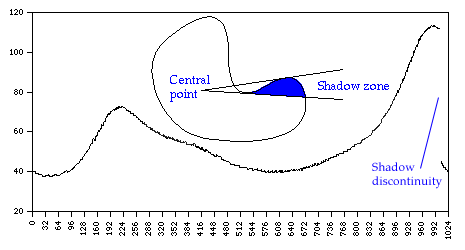
This illustrates a desirable attribute for Fourier analysis, the series is periodic if the outline is closed. As before, the series would be symmetric if the centre of the square was chosen as the point from which the rays radiated. As this technique is applied to more complicated outlines an obvious problem presents itself if the rays intersect the boundary more than once, since we require a one-to-one or many-to-one function we can only choose the first sample. The result geometrically is that part of the outline is in "shadow". The series will normally have a discontinuity at one edge of the shadow.
Example - shadow zone

In the above example the central point can be chosen so that there are no shadow zones, of course this will not always be possible! Note that it doesn't follow that concave shapes will result in shadow zones. Software
A simple utility has been written called "radial sample" which
allows the user to open a black and white PICT and select the number
of points at which to sample the outline. When the user selects a
central point the radial series will be computed and the user
prompted for a file in which to save the samples. The file is a
text document with one sample per line, this can be readily
read with the users favourite graphing and analysis software.
|