Representing and rendering molecular structuresWritten by Paul BourkeDecember 2002
The following examples result from a project to convert and represent molecules from a number of file formats (PDB, MOL2, ALC, AL2,...) primarily for visual appeal rather than for analysis. The rendering was to be performed using a number of rendering packages, both public domain and commercial (PovRay, Tachyon, 3DStudioMax, LightWave, ....). In order to convert the geometric structure (atoms and bonds) into a format suitable for each package, it was decided to define a minimal format from which translators to a particular rendering package would be written. This is a fairly standard approach, instead of writing a converter between every combination of input format and output format, translators are written from every input format to a single format and another translator converts from this single format to each output format. This intermediate format is typically called a meta format because it usually supports all the features of the input formats, in this case it was designed so it only supports the minimal requirements required for the rendering. In some cases the translator from this meta file format can be parsed by the scripting language of the rendering package (eg: 3DStudioMax), in other cases it may be written as another piece of C/C++ code. 
The simple file format (.txt below) was a human readable file arranged in lines. The first character of each line determines the data on the rest of the line. At this time there are only three line types, comments (#), atoms (a), and bonds (b). A comment line is ignored. An atom line contains an atom name followed by the (x,y,z) coordinate. A bond line consists of a bond name followed by two (x,y,z) coordinates. An example of such a file is given below.
# Header:  ASPIRIN
# X axis range: -3.0887 <= x <= 2.6701
# Y axis range: -3.2334 <= y <= 2.8925
# Z axis range: -0.9708 <= z <= 3.1468
# Number of atoms: 21
# Number of bonds: 21
# Unique atoms: 6
# Unique bonds: 3
a CAR -2.1016 -1.1628 -0.4897
a CAR -0.006 -0.0142 -0.1081
a CAR -1.3176 -0.0099 -0.5663
a C2 1.8754 -1.2008 1.1918
a O3 2.6701 -0.1455 1.1998
a O3 0.5437 1.164 0.004
a H -3.0887 -1.1326 -0.8969
a H -0.97 0.4657 2.0214
a H -1.2187 2.1784 2.3783
a H 0.1367 1.2646 3.1468
         :
         :
b CAR_CAR -1.5789 -2.3192 0.0985 -2.1016 -1.1628 -0.4897
b CAR_CAR -1.3176 -0.0099 -0.5663 -0.006 -0.0142 -0.1081
b CAR_CAR -1.3176 -0.0099 -0.5663 -2.1016 -1.1628 -0.4897
b C2_CAR 1.8754 -1.2008 1.1918 0.4982 -1.1562 0.5665
b C2_O3 0.4587 1.8545 1.1222 0.5437 1.164 0.004
b O2_C2 1.0904 2.8925 1.2405 0.4587 1.8545 1.1222
b C3_C2 -0.452 1.4066 2.2316 0.4587 1.8545 1.1222
b CAR_H -0.288 -2.3169 0.6237 0.0906 -3.2334 1.0831
b CAR_H -1.3176 -0.0099 -0.5663 -1.6981 0.9134 -0.9708
b O3_H 2.6701 -0.1455 1.1998 2.357 0.612 0.7625
         :
         :
Example Aa.alc, a.pdb, a.txt 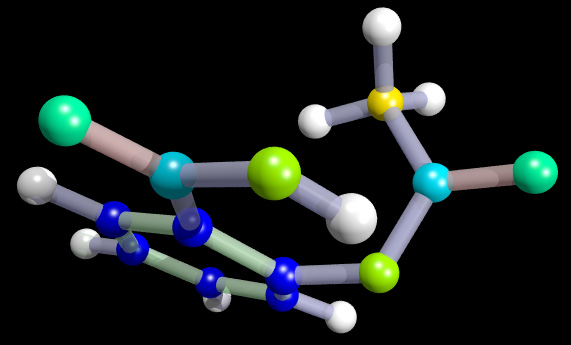 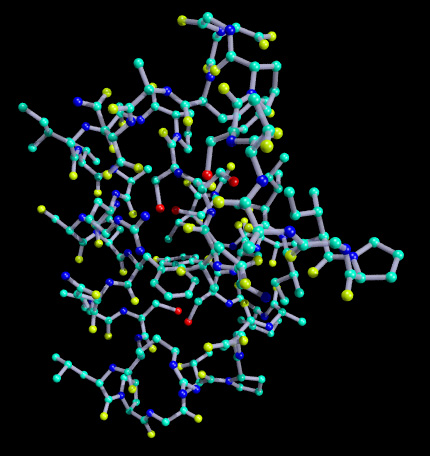
Isosurface 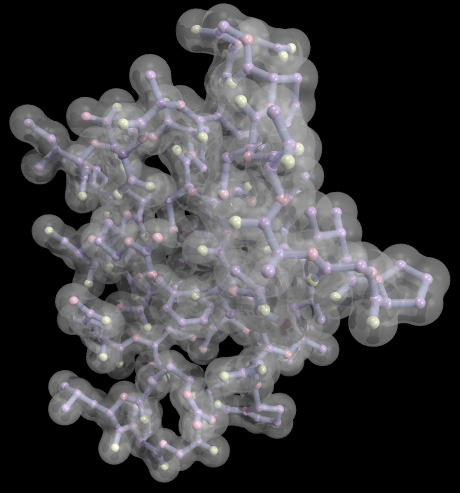 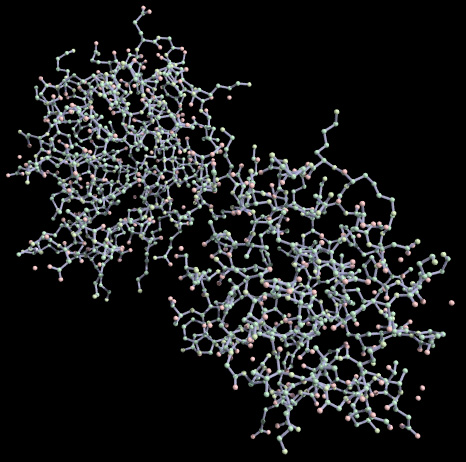
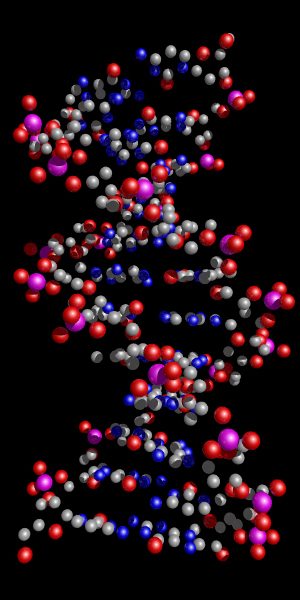
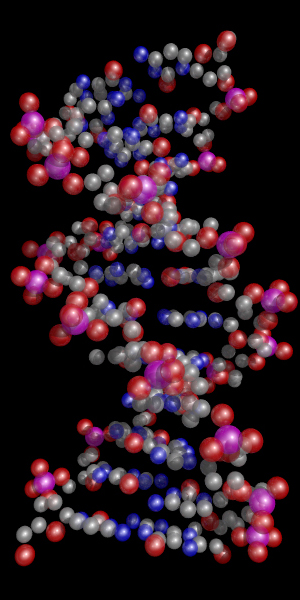
Space Filling 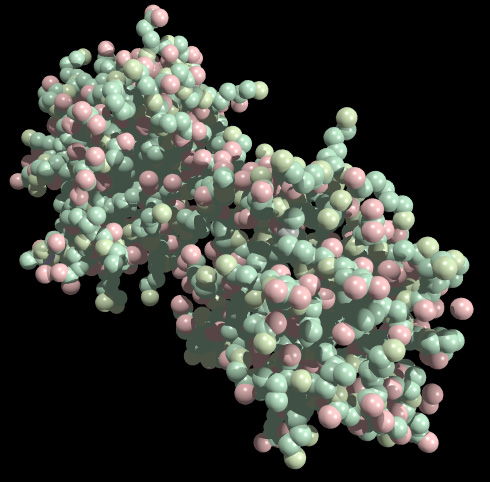 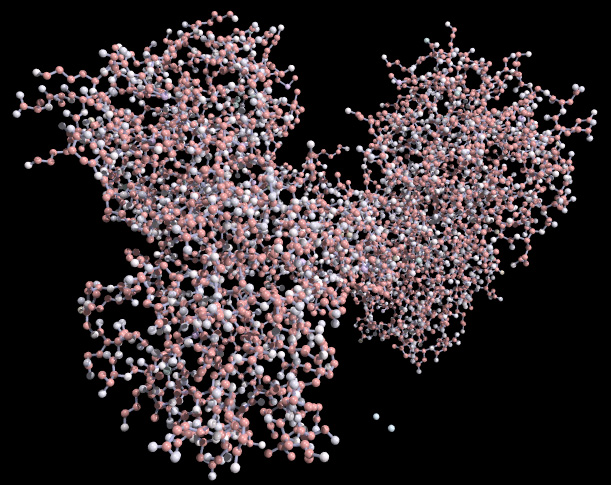
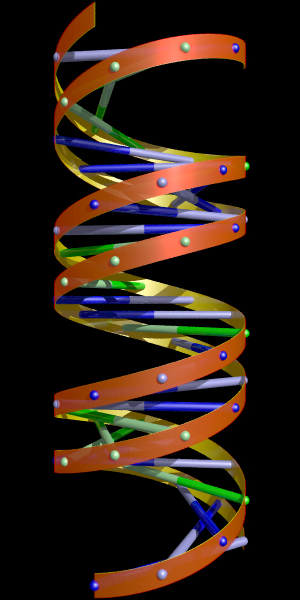
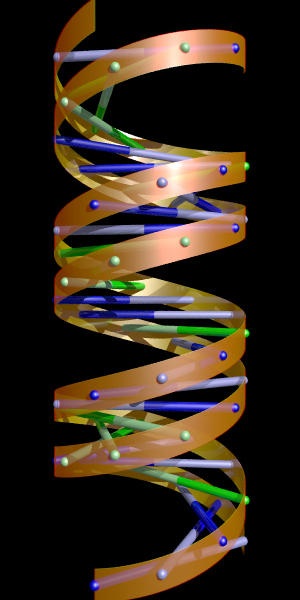
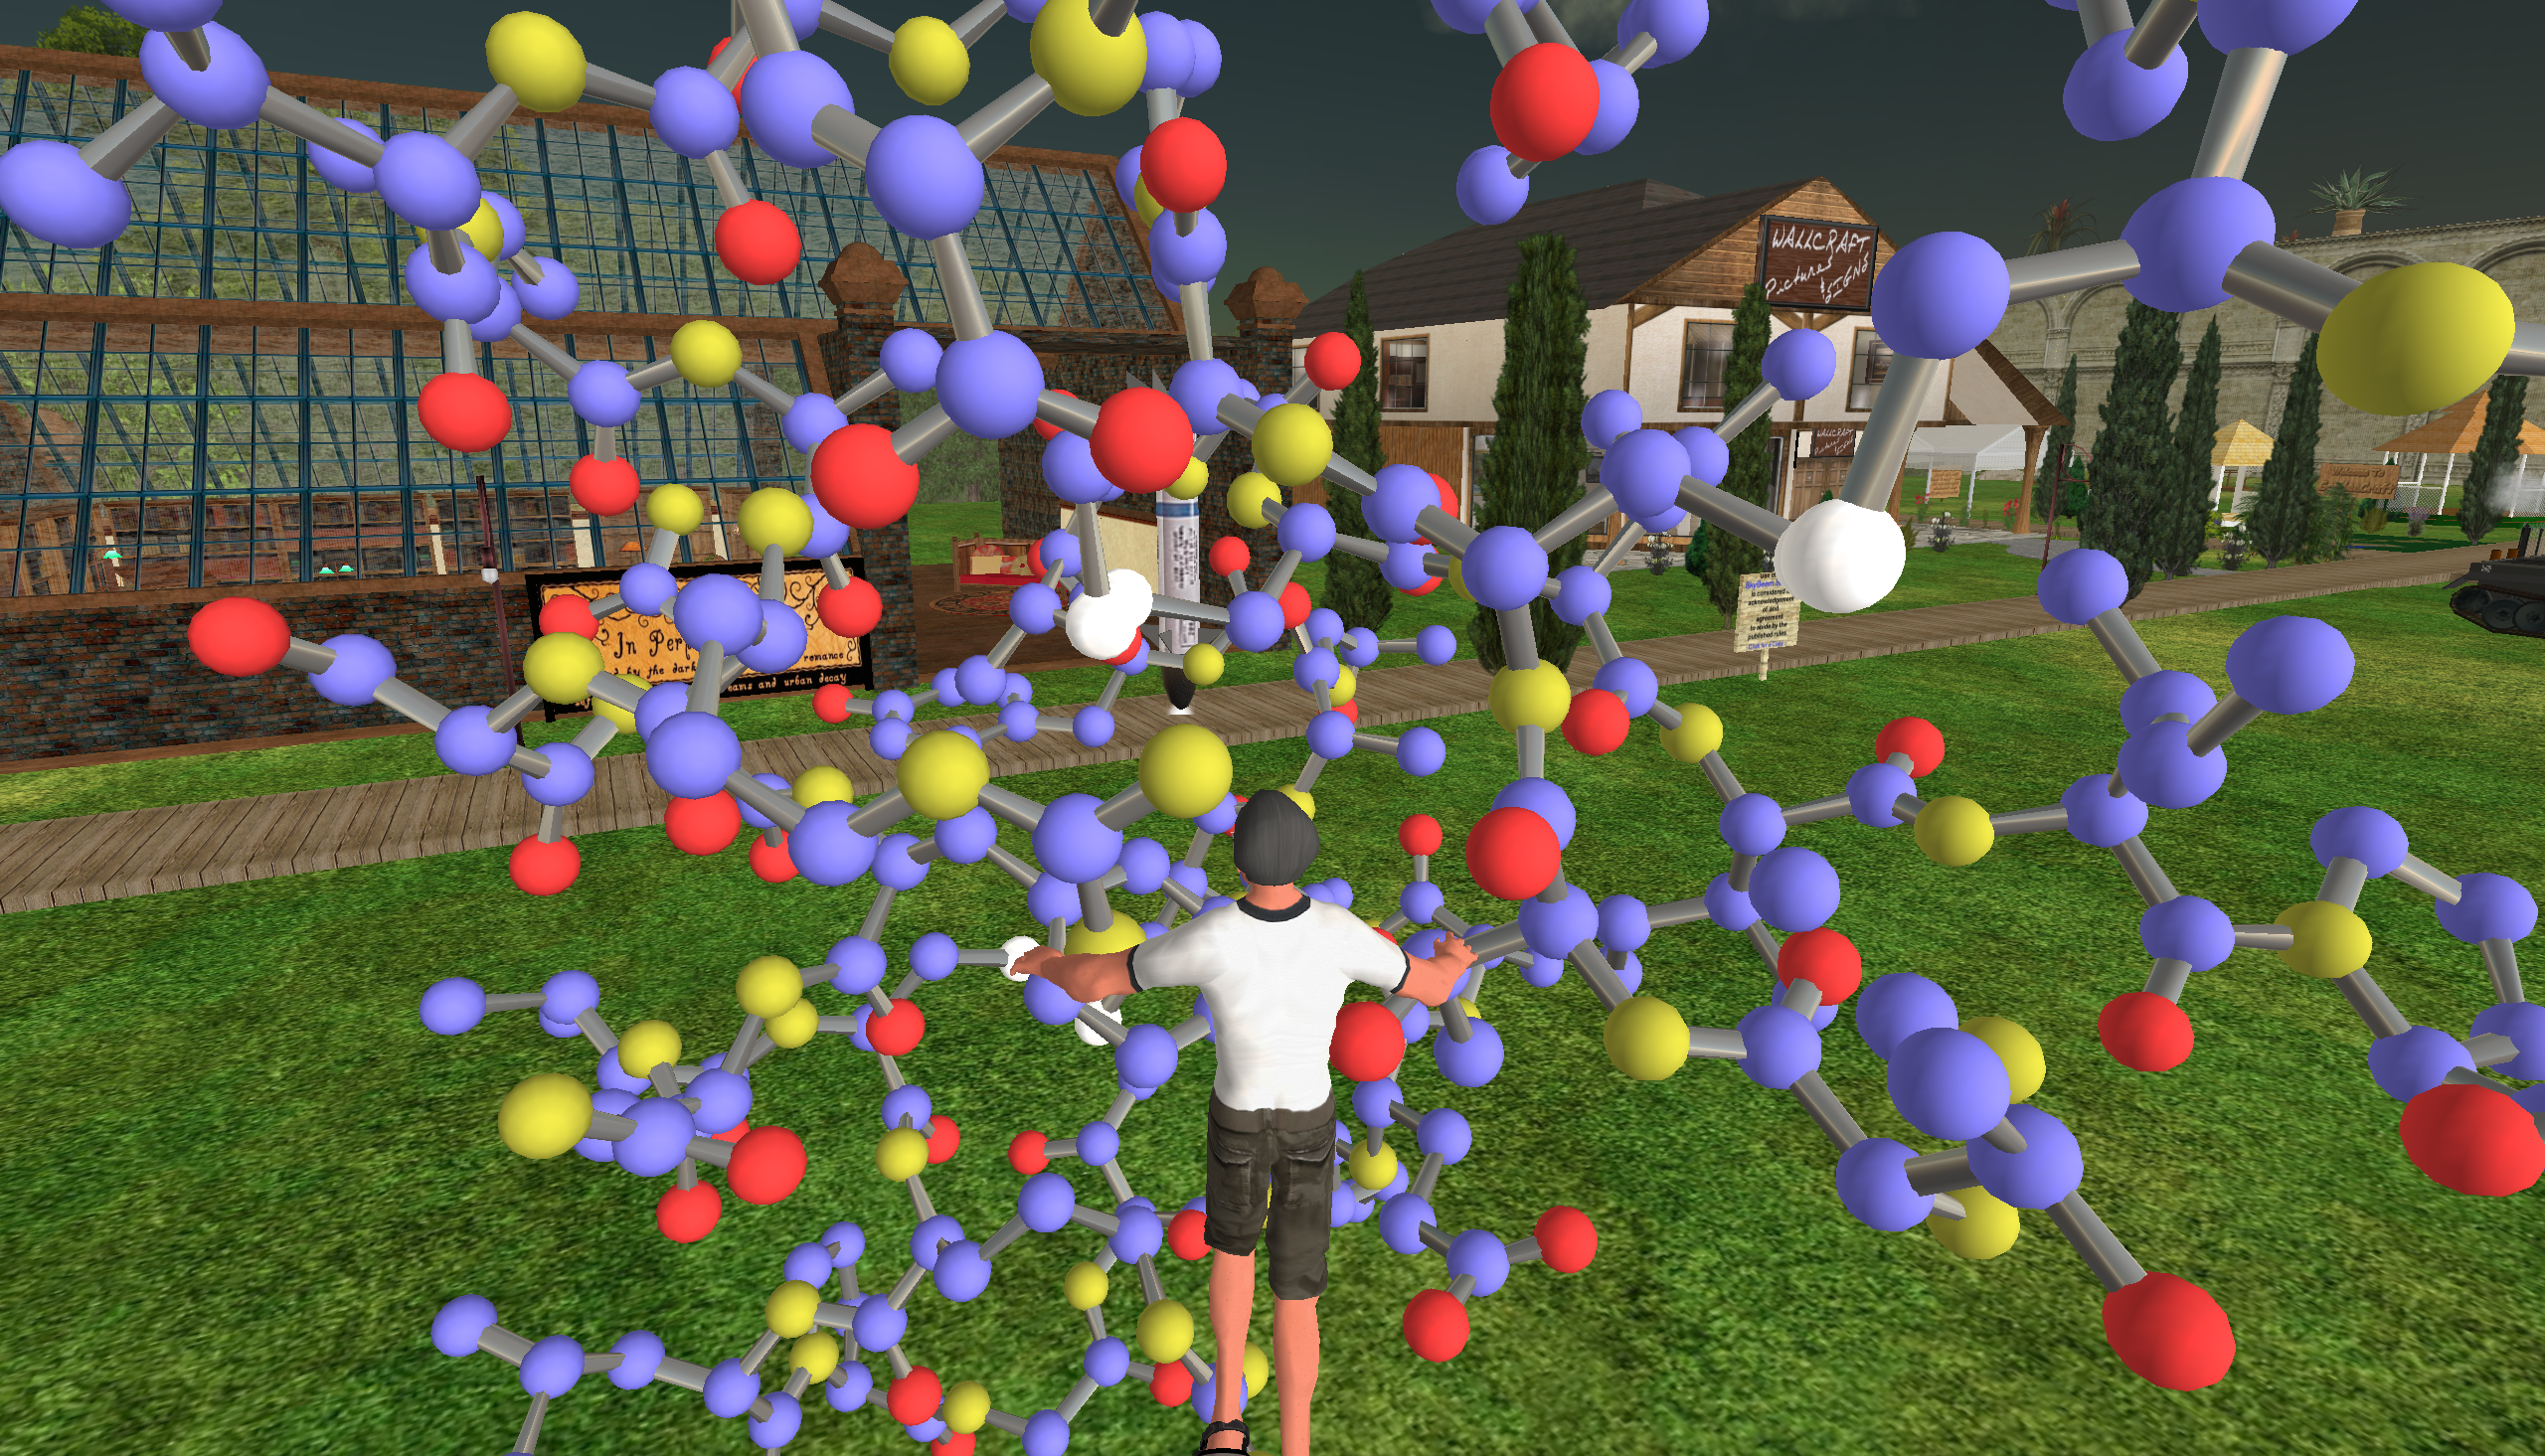
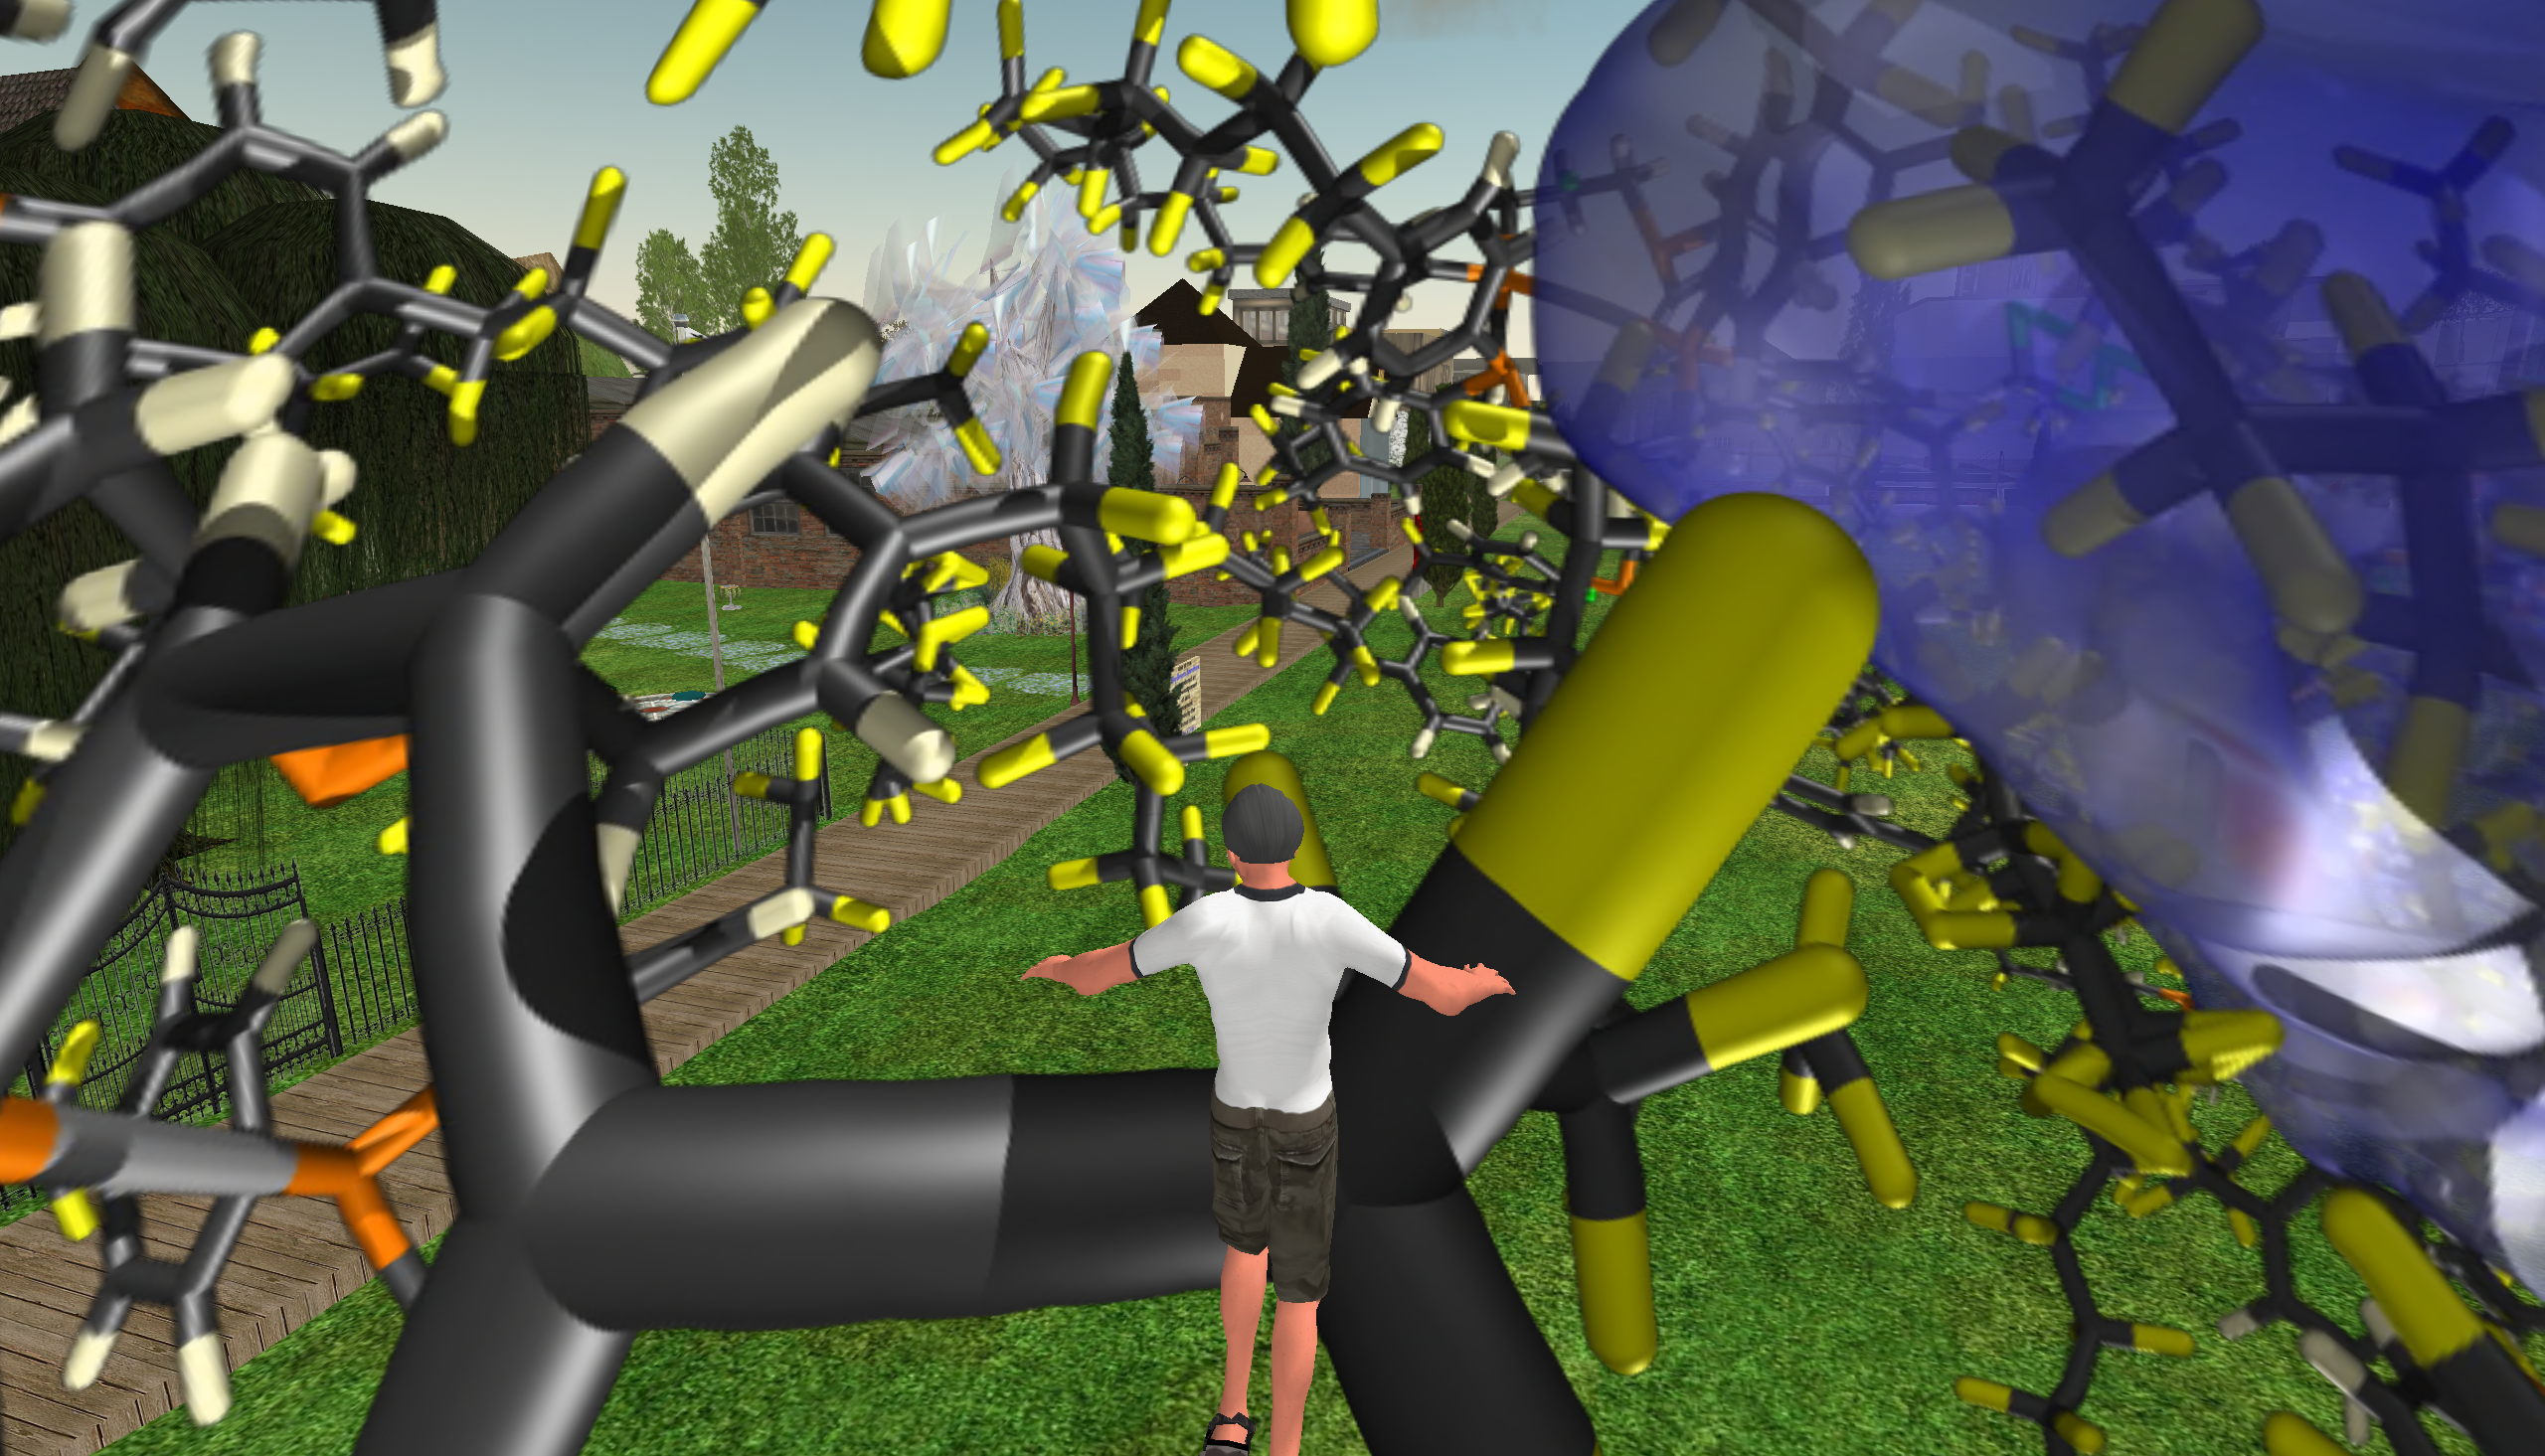
Bonds only 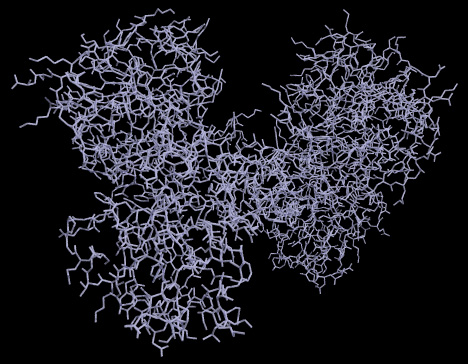 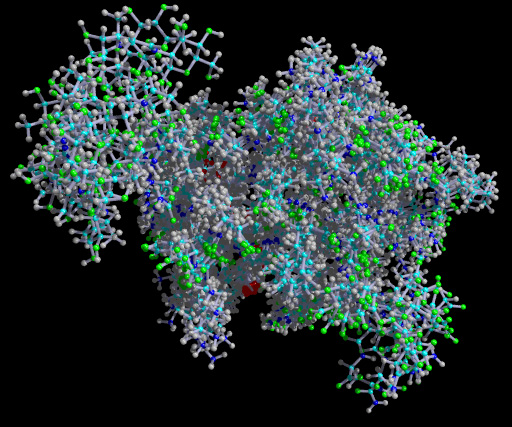 3DStudioMax script to read the ".txt" files. Further examples of DNA strands

|