Visualisation of HPC queue statisticsPaul BourkeNovember 2006
The following is an example of a visualisation of jobs running on a HPC facility, namely a 176 processor SGI Altix machine. The jobs are submitted through the PBS (Portable Batch System) queuing system, this manages the job execution on the CPUs and is the way a user normally interfaces with the machine. The way one normally checks the status of the queuing system is through command line utilities such as "qstat" and "nqstat". For example, to inspect all the queue entries running one might use "nqstat -a", the result typically looks as follows.
                              %CPU  WallTime  Time Lim     RSS   vmem memlim cpus
normal = open&run = QdCpus=150 ============= 192:00:00 =============== 160GB  80
364828 R   kate cm01 s2feznca  100  22:42:02  50:00:00  6583MB 7604MB 8000MB   8
364829 R   kate cm01  s110_r6  100  22:40:49  50:00:00  5982MB 6945MB 8000MB   8
364830 R   kate cm01 ssurf_fe  100  28:42:58  41:40:00  20.1GB 23.0GB 23.4GB  16
364831 R   kate cm01     bvzn  100  28:40:36  33:20:00  9709MB 10.4GB 15.6GB   8
364956 R  piana md01    job16  100  14:55:24  24:00:00  1226MB 3172MB 4000MB  16
364962 R  piana md01    job16  100  10:56:59  24:00:00  1411MB 3448MB 4000MB  16
364966 R  piana md01     job8  100  07:52:56  24:00:00  1147MB 2053MB 4000MB   8
364967 R  piana md01     job8  100  10:50:04  24:00:00  1477MB 2385MB 4000MB   8
364970 R franca md02 corretch  100  09:41:23 192:00:00   333MB  363MB 2048MB   1
364971 R franca md02   stepBC  100  09:40:49 192:00:00  1973MB 2002MB 2048MB   1
365045 R andrew qc03   dogDZP  100  05:09:46  12:00:00  3459MB 4926MB 8192MB   8
365046 R andrew qc03  dogDZ2P  100  05:09:48  12:00:00  3014MB 4037MB 8192MB   8
365047 R andrew qc03   dogTZP  100  05:20:07  12:00:00  3109MB 4037MB 8192MB   8
365051 R andrew qc03  dogTZ2P  100  08:18:08  12:00:00  3283MB 4237MB 8192MB   8
365052 R andrew qc03 deoxygal  100  08:18:06  12:00:00  2487MB 3439MB 8192MB   8
365057 R  piana md01    job16  100  07:30:32  24:00:00  1528MB 5244MB 8000MB  16
365079 R cle101 cg01 Grid_ng2  100  02:30:06  23:20:00   102MB  165MB 2000MB   1
The aim was to represent the key statistics (some are not given above but need to be queried by other means) graphically such that an immediate snapshot of the state of the queue can be appreciated. This would be used not only by users who have jobs in the queue already but by users who plan to submit jobs in the near future .... and of course it is a great way to present the processing state to visitors. The result is an application called "gqstats" that, behind the scenes, interrogates the PBS queueing system and presents the results graphically to the user. This is achieved by making an ssh connection to the machine, as such one needs an account on the remote machine. Sample screen dump
An example screen dump is given below from the resulting application. The queue is interrogated regularly and the graphics updated accordingly. Note that the queue is essentially a linear structure, the spring was chosen simply because it allows the 1D queue to be represented as a compact 3D structure. 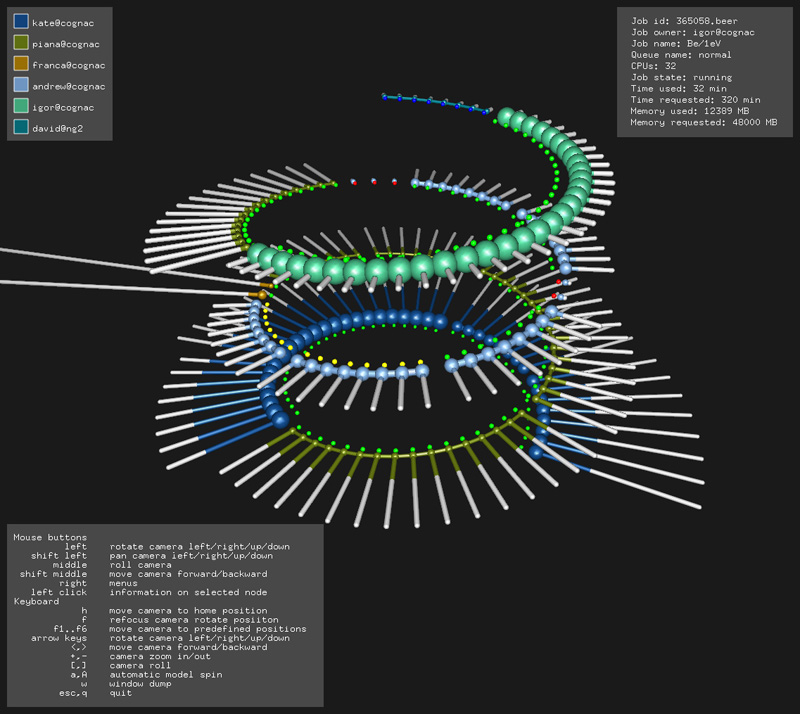 Graphical language
The statistics represented graphically are: groups of processes made up on MPI jobs, the time allocated and the time used, the current memory usage, the job state (running, queued, suspended, etc) and the user. Some additional statistics are displayed in the top right corner of the window if the user clicks on one of the graphical items that represents a queue entry. How these variables are mapped to graphical features is illustrated bellow. 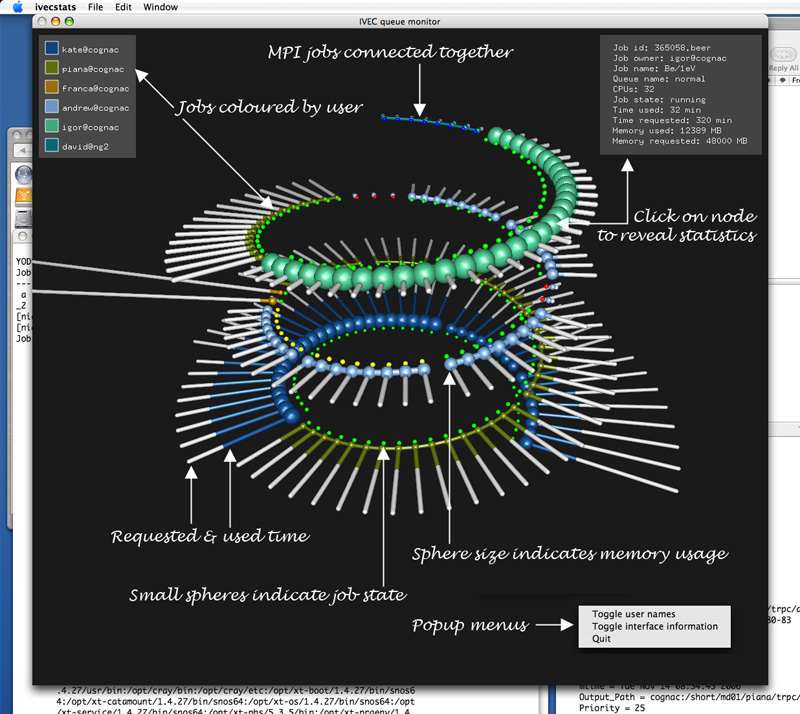 Usage
At the time of writing the application is available as a UNIX style application for Mac OS-X and Linux. It additionally operates in stereo 3D if a suitable graphics card' is available. The command usage string is given below.
Usage: gqstats [command line options]
Command line options
           -h    this text
           -f    full screen
           -s    active stereo
          -ss    dual screen stereo
         -q s    look at this queue only, otherwise all queues
         -u s    optional user name on remote machine, otherwise local user name
         -m s    optional machine name
         -p s    optional path to qstat, if required
         -r n    sphere resolution (eg: 8, 12, 18)
         -t n    update time in seconds
Mouse
              left    rotate camera left/right/up/down
            middle    slide vertically
      shift middle    move camera forward/backward
             right    menus
        left click    information on selected node
Keyboard
                 f    refocus camera positon
            f1..f6    move camera to predefined positions
  left/right arrow    rotate camera horizontally
     up/down arrow    slide camera vertically
               <,>    move camera forward/backward
               +,-    camera zoom in/out
               [,]    camera roll
               a,A    automatic model spin
                 w    window dump
             esc,q    quit
UpdatesDec 2006One may now click on a user (top left panel) and only that users jobs will be shown in colour, this is for quick identification of user jobs. 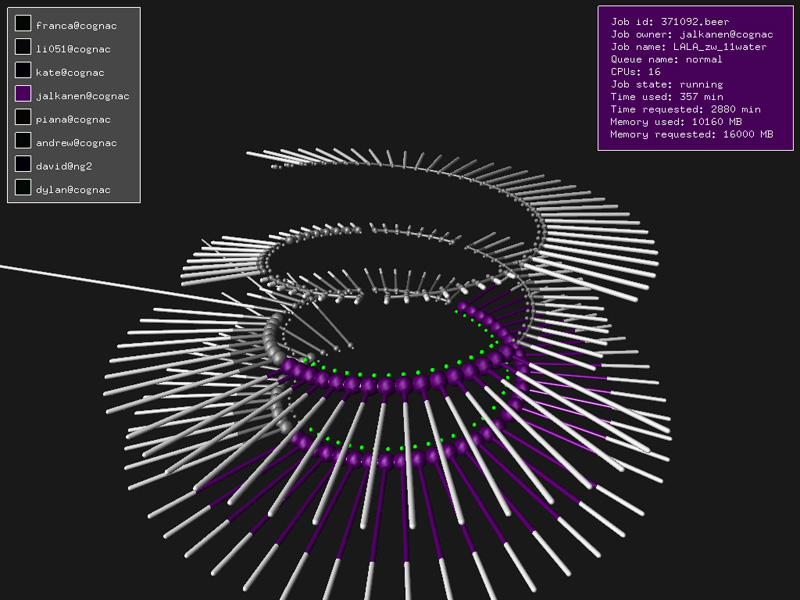 Jan 2007 Once a job is selected it can be removed from the queue, see menus (right mouse button).
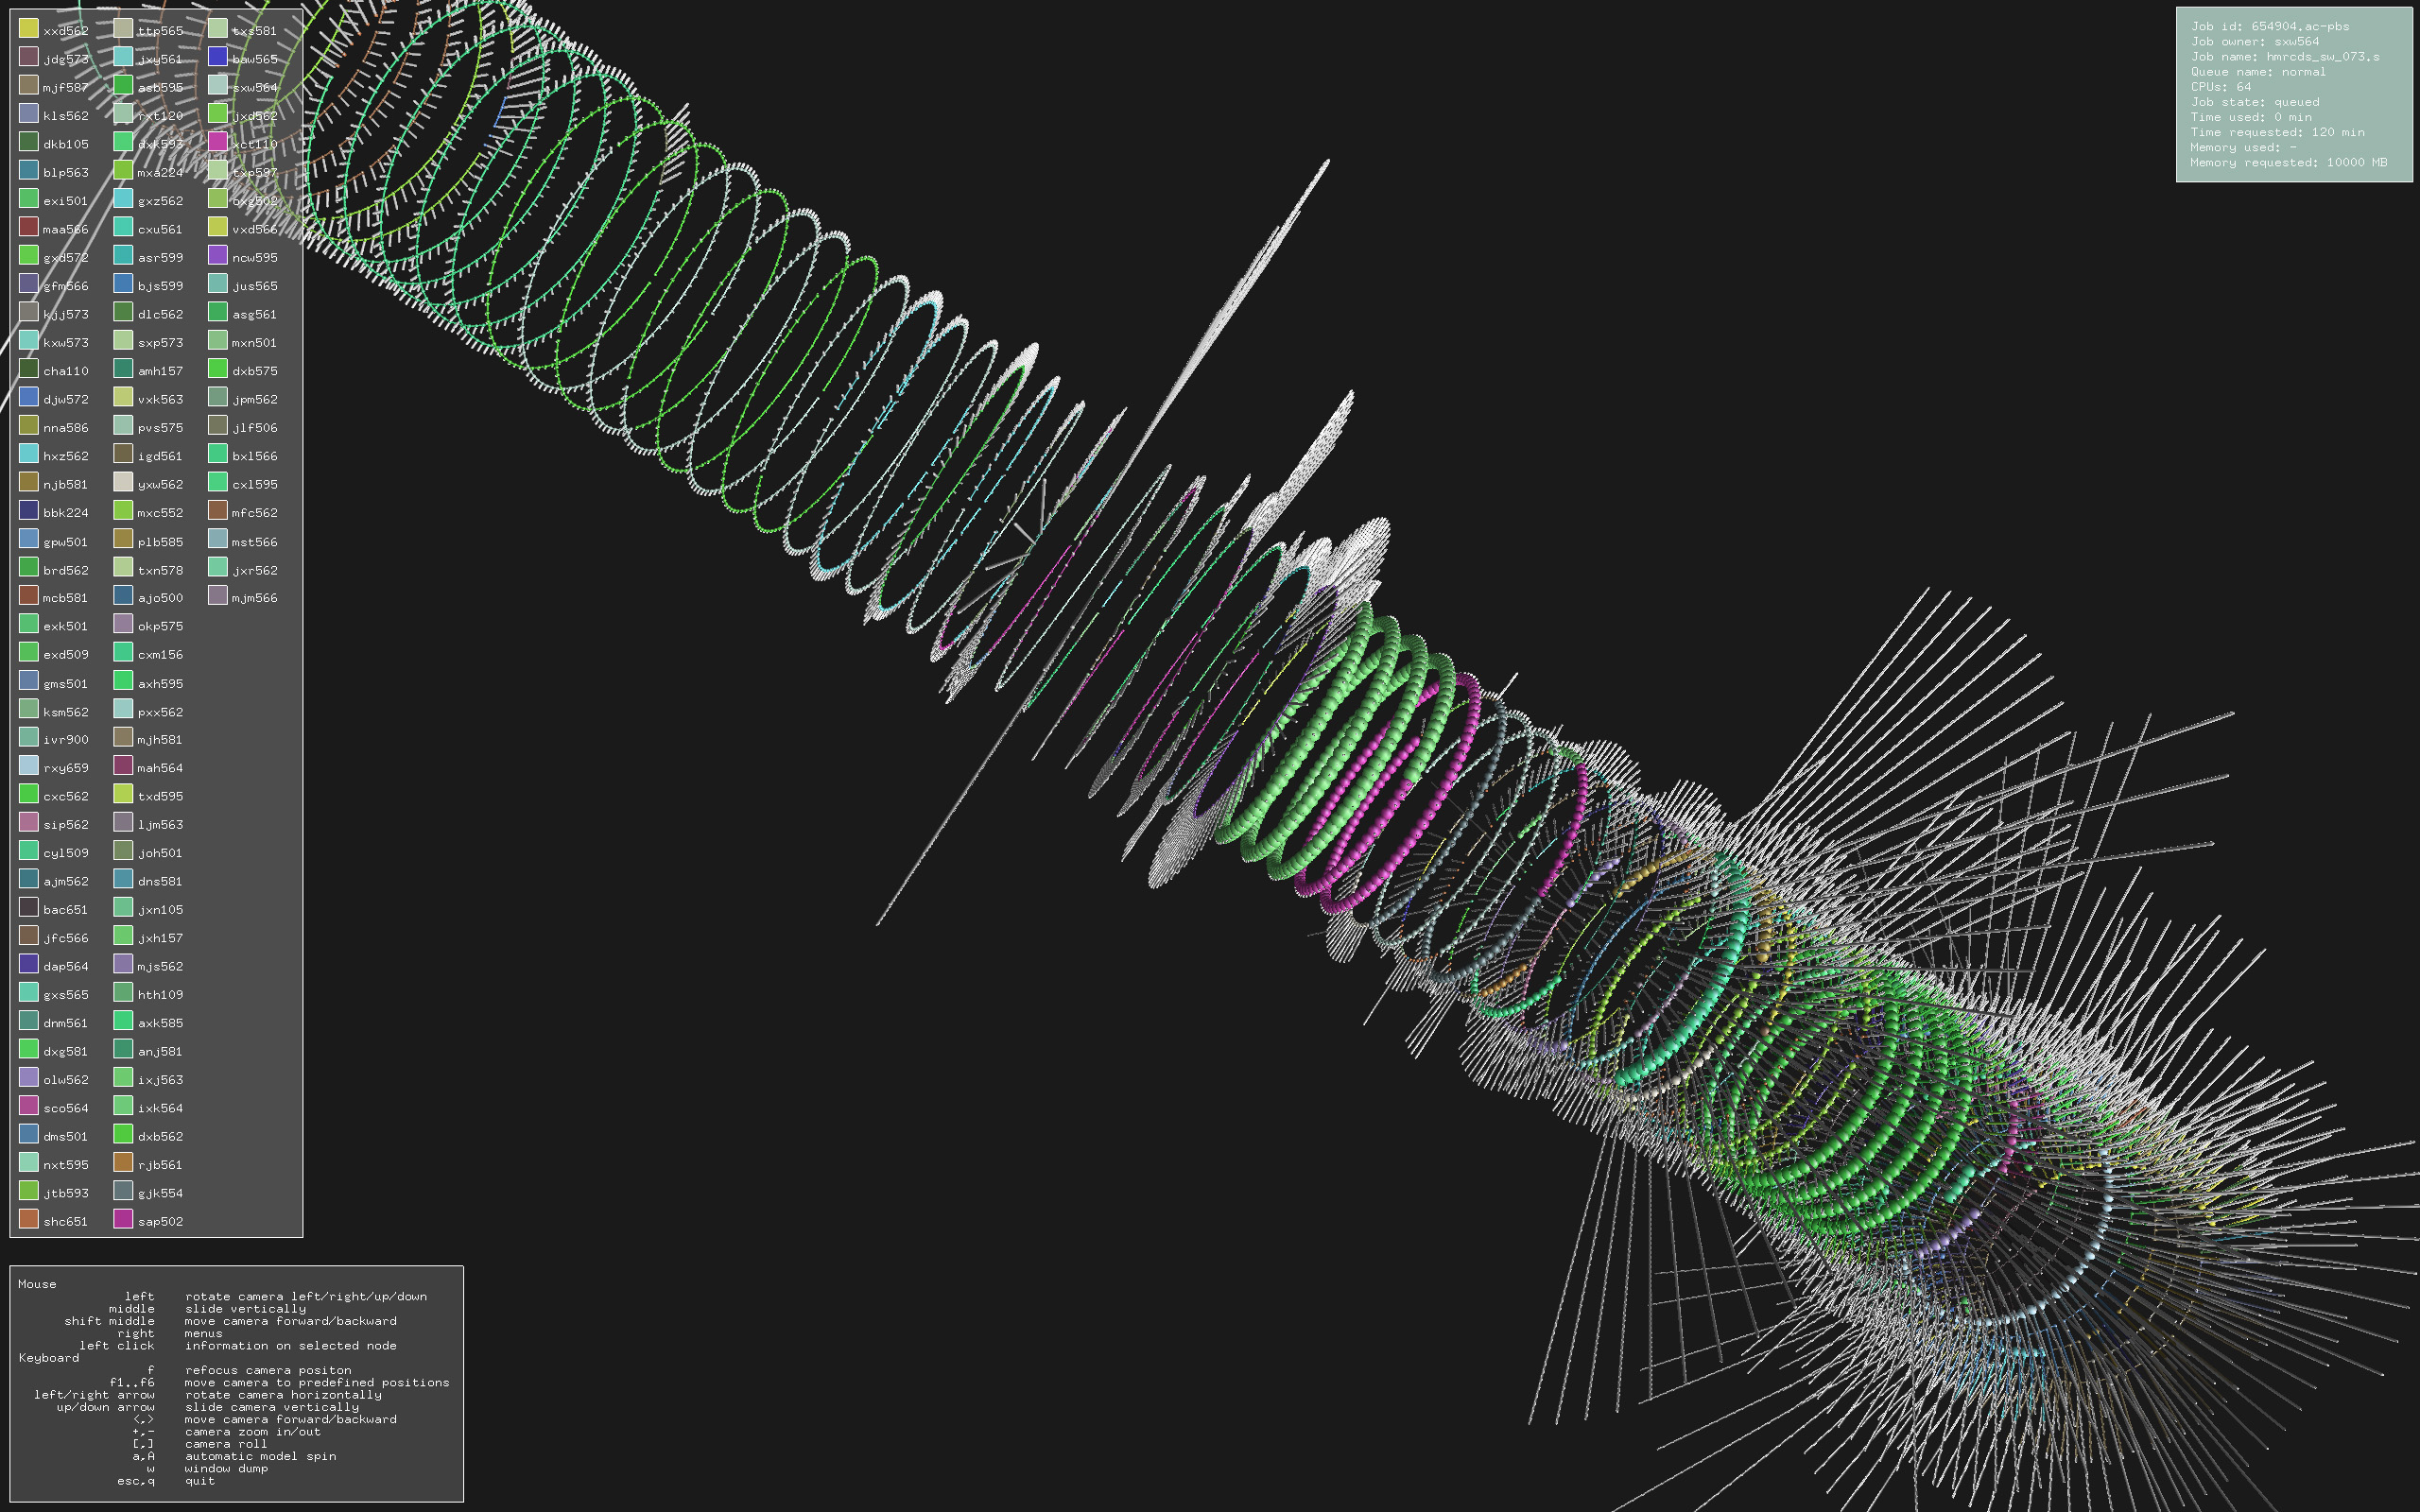
Largest queue so far
Variation for a Cray XT3A variation of the above has been developed for a Cray XT3. In this case instead of reflecting the state of the PBS queue, the underlying topology of the XT3 is used. Each node in the images below is a processor, the connectivity is shown as pipes between the nodes (toroidal cubic structure). 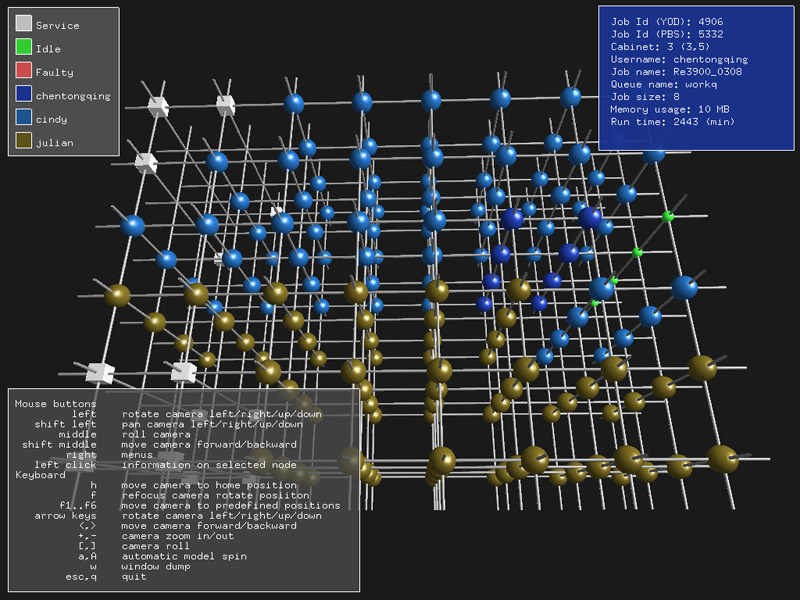
The information available about the jobs on the nodes is rather limited (at least not readily documented), the information about jobs and users is a combination of data from "xtshowmesh" and PBS reporting tools. The "trick" is matching yod based information with the PBS information ... they each assign independent job IDs! 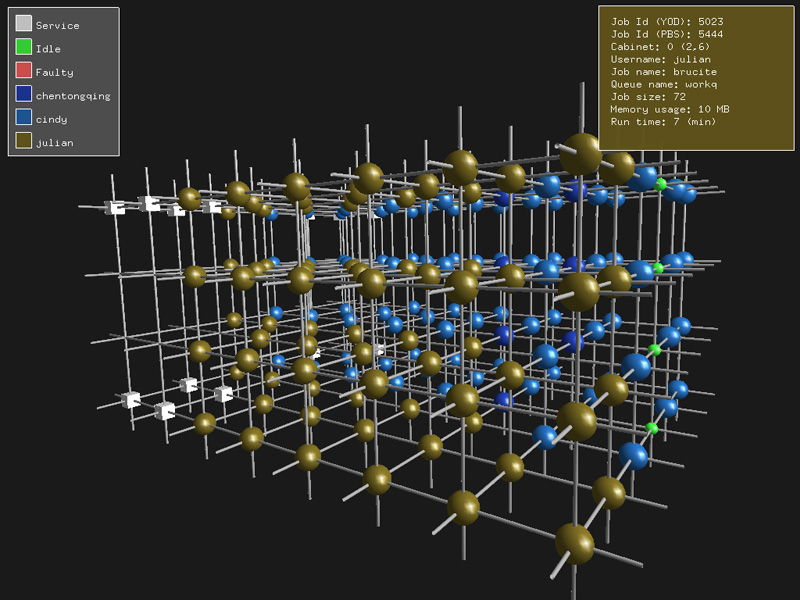
Note that the connections that leave each face of the cube wrap around to the opposite face. 
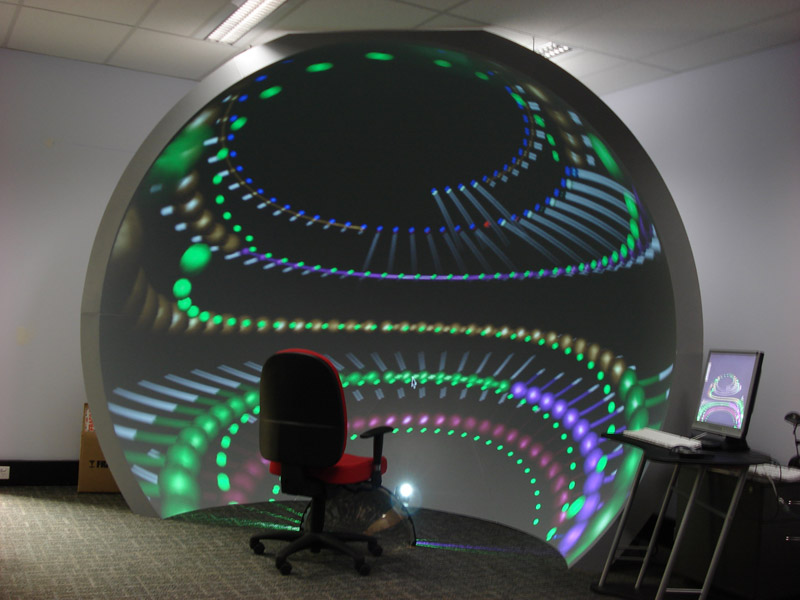
Update June 2007Implementation within an immersive environment: iDome
|