Data visualisation in crystal
Written by Paul Bourke
May 2008
|
| |
Further to ideas involving
tactile visualisation using rapid prototyping machines,
there are some datasets for which such techniques are not practical, namely for
disjoint geometry. The discussion here revolves around laser based machines that can
induce tiny bubbles in crystal, the exploration here applies these techniques to
science datasets compared to the tourist fare the machines are usually used for.
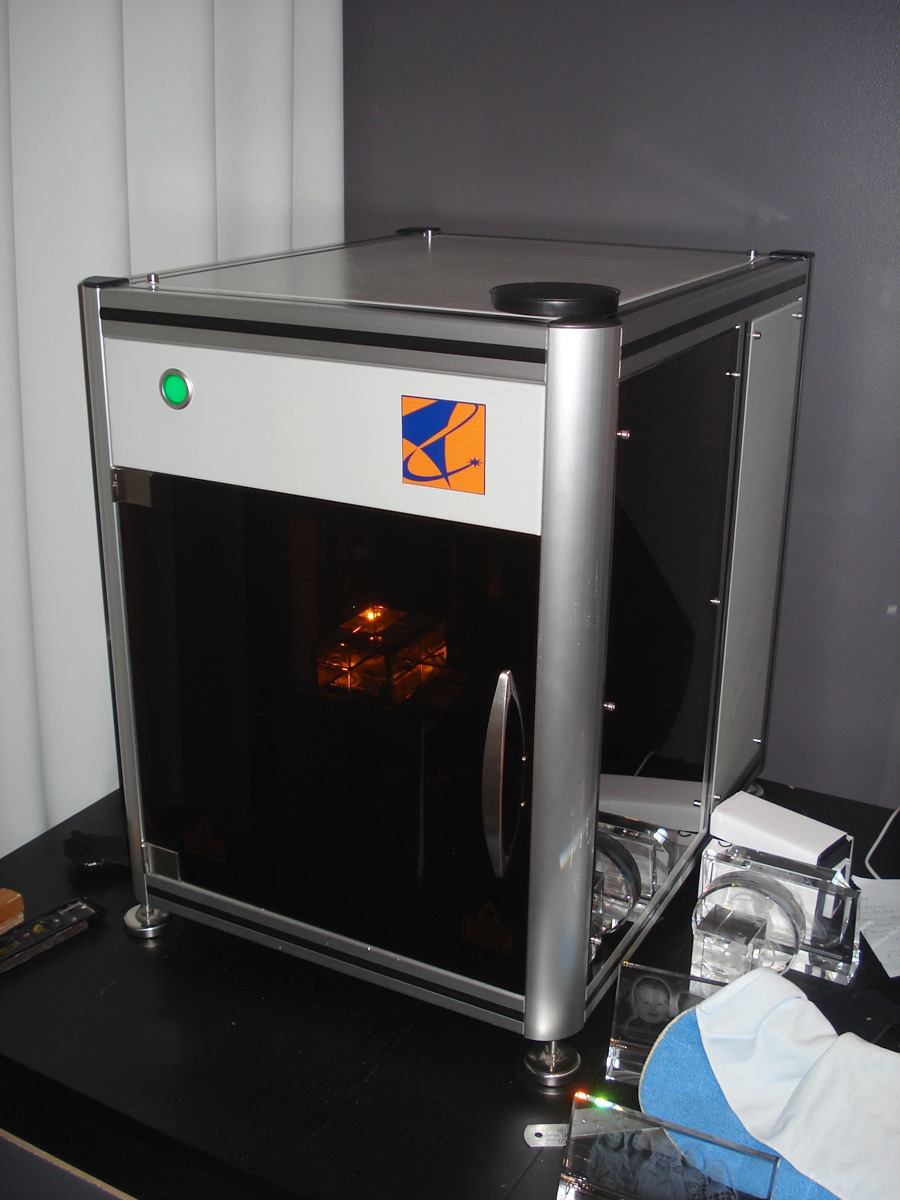
The machine used here is shown on the right. The standard rectangular blocks are in
the order of 10cm cubed maximum. The bubbles are formed by focused laser beams.
Interestingly the process is
capable of about 1000 points per second. In the case here the data is supplied as a point
cloud as a DXF file, see later for a sample format.
|
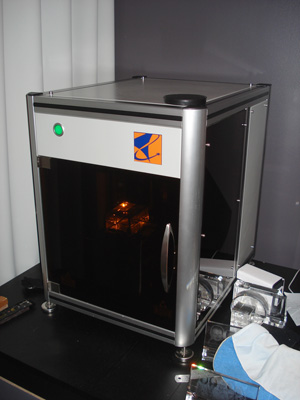
The machine
| | |
|
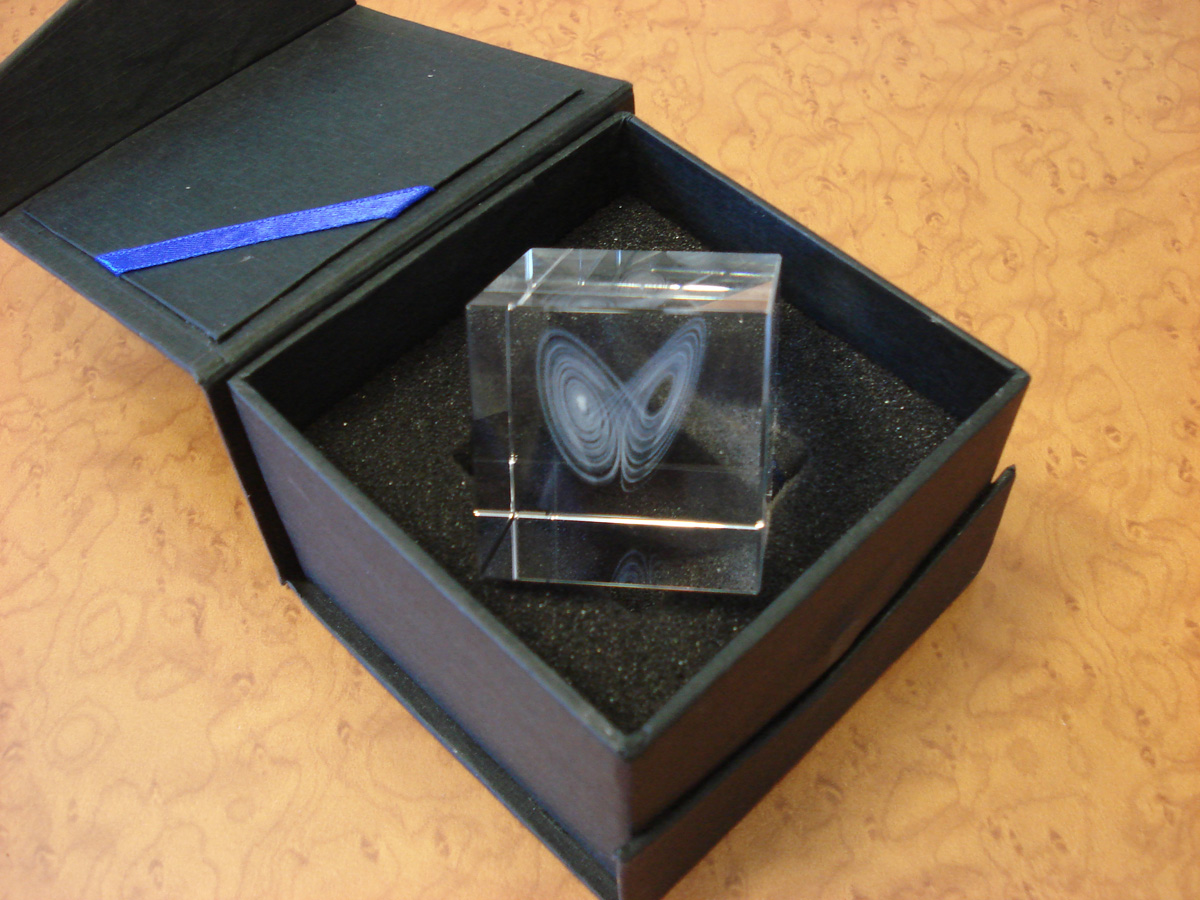
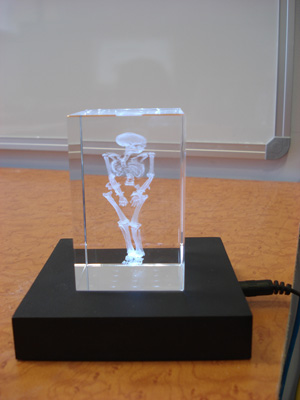
Tests #1
| | |
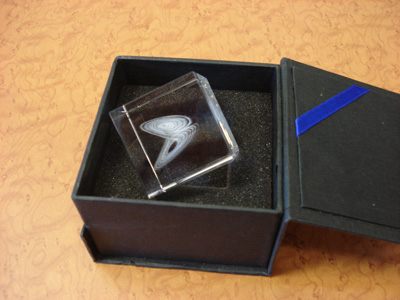
Lorenz attractor
|

37000 points
| | |
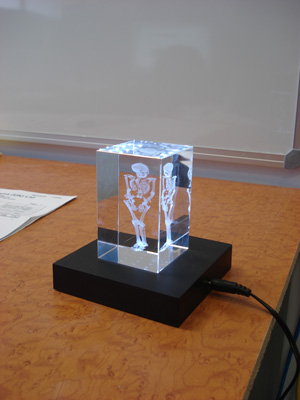
6dF galaxy survey
|
120,000 points
| | |
|
Only the most basic of DXF file is required.
The minimal structure is as follows:
0
SECTION
2
ENTITIES

[point description goes here]

0
ENDSEC
0
EOF
Each point is described as the following example, the actual 3D positions of the
point are the numbers following the "10", "20", and "30" lines.
0
POINT
8
LAYER1
10
-29.2
20
-42.5
30
-252.0
| | |
|
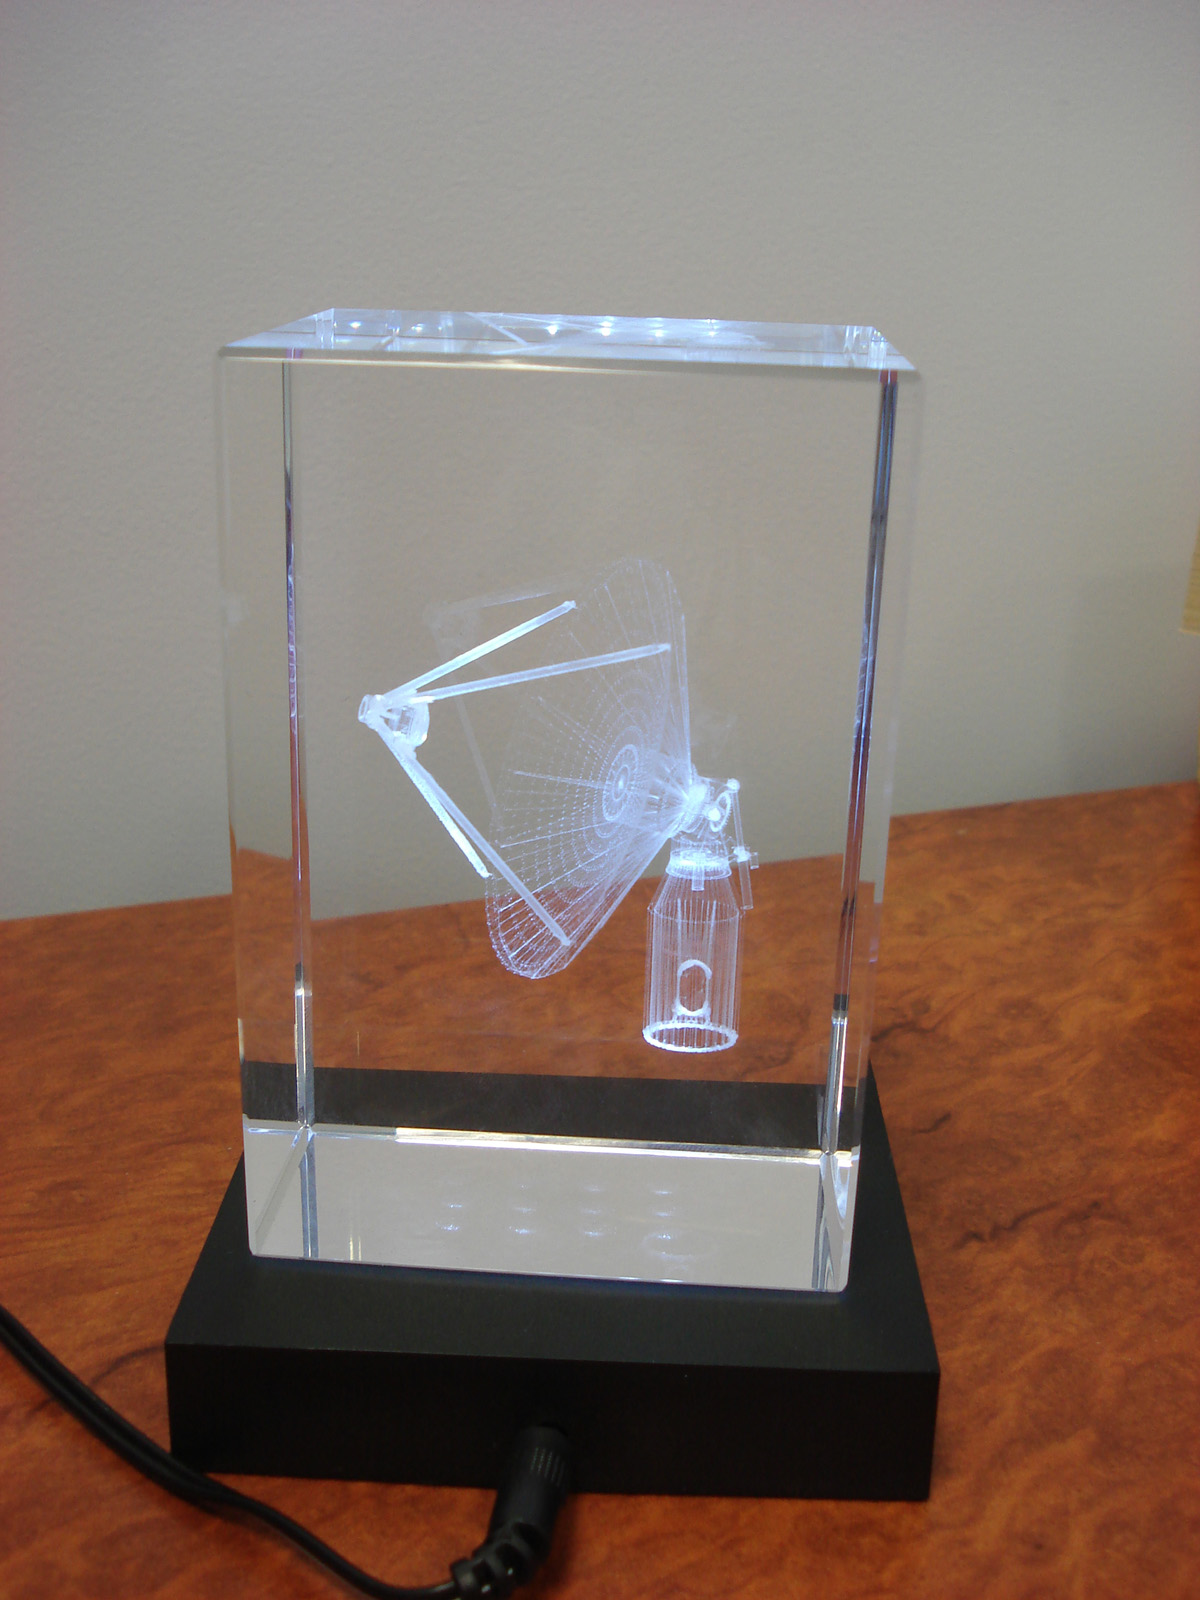
Tests #2, July 2008
| | |

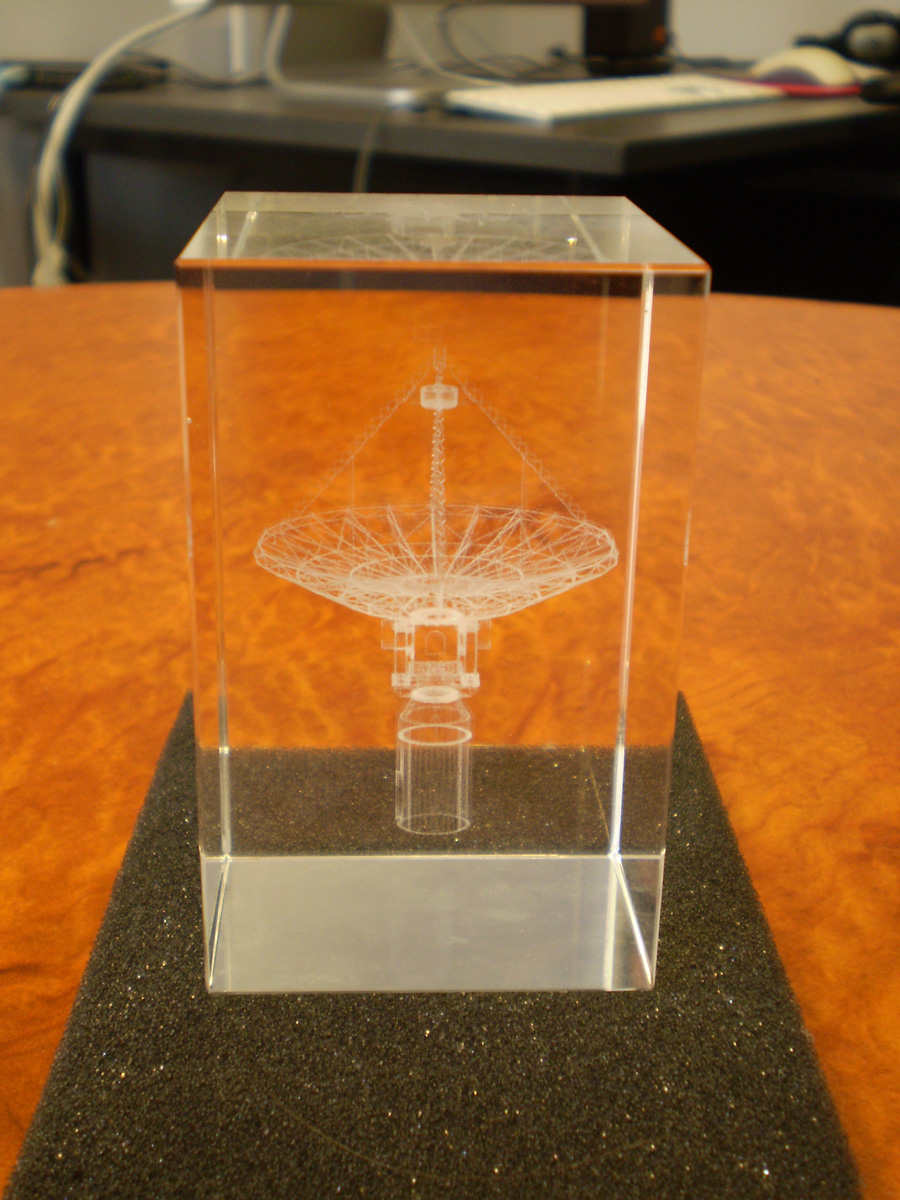
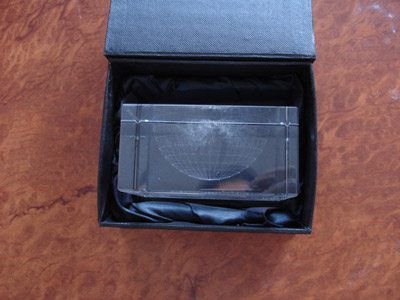
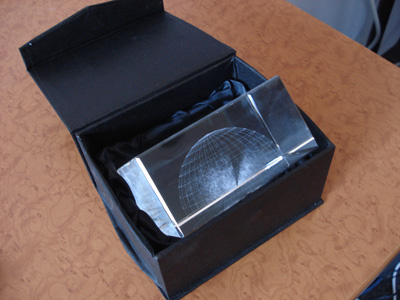
ASKAP radio telescope dish
|
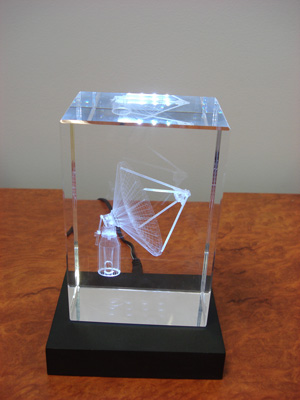
1,500,000 points
| | |
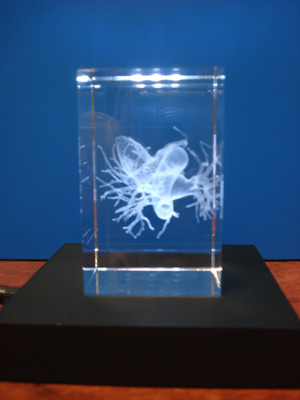
Mummy, isosurface from CAT scan data.
|
1,700,000 points
| | |
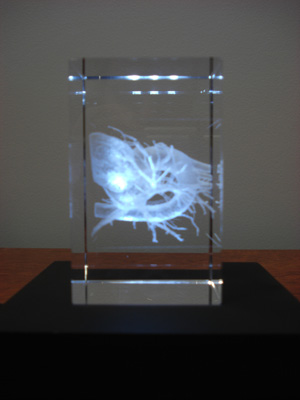
Human heart
|
| | |
|
Poster
| | |
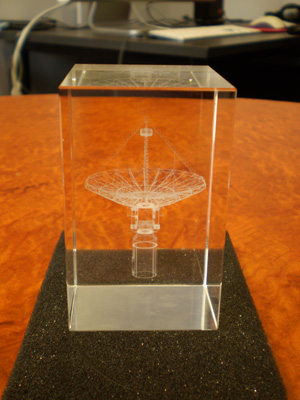
Latest ASKAP radio telescope dish design
|
| | |
|