Henon Phase DiagramsWritten by Paul BourkeJanuary 1991
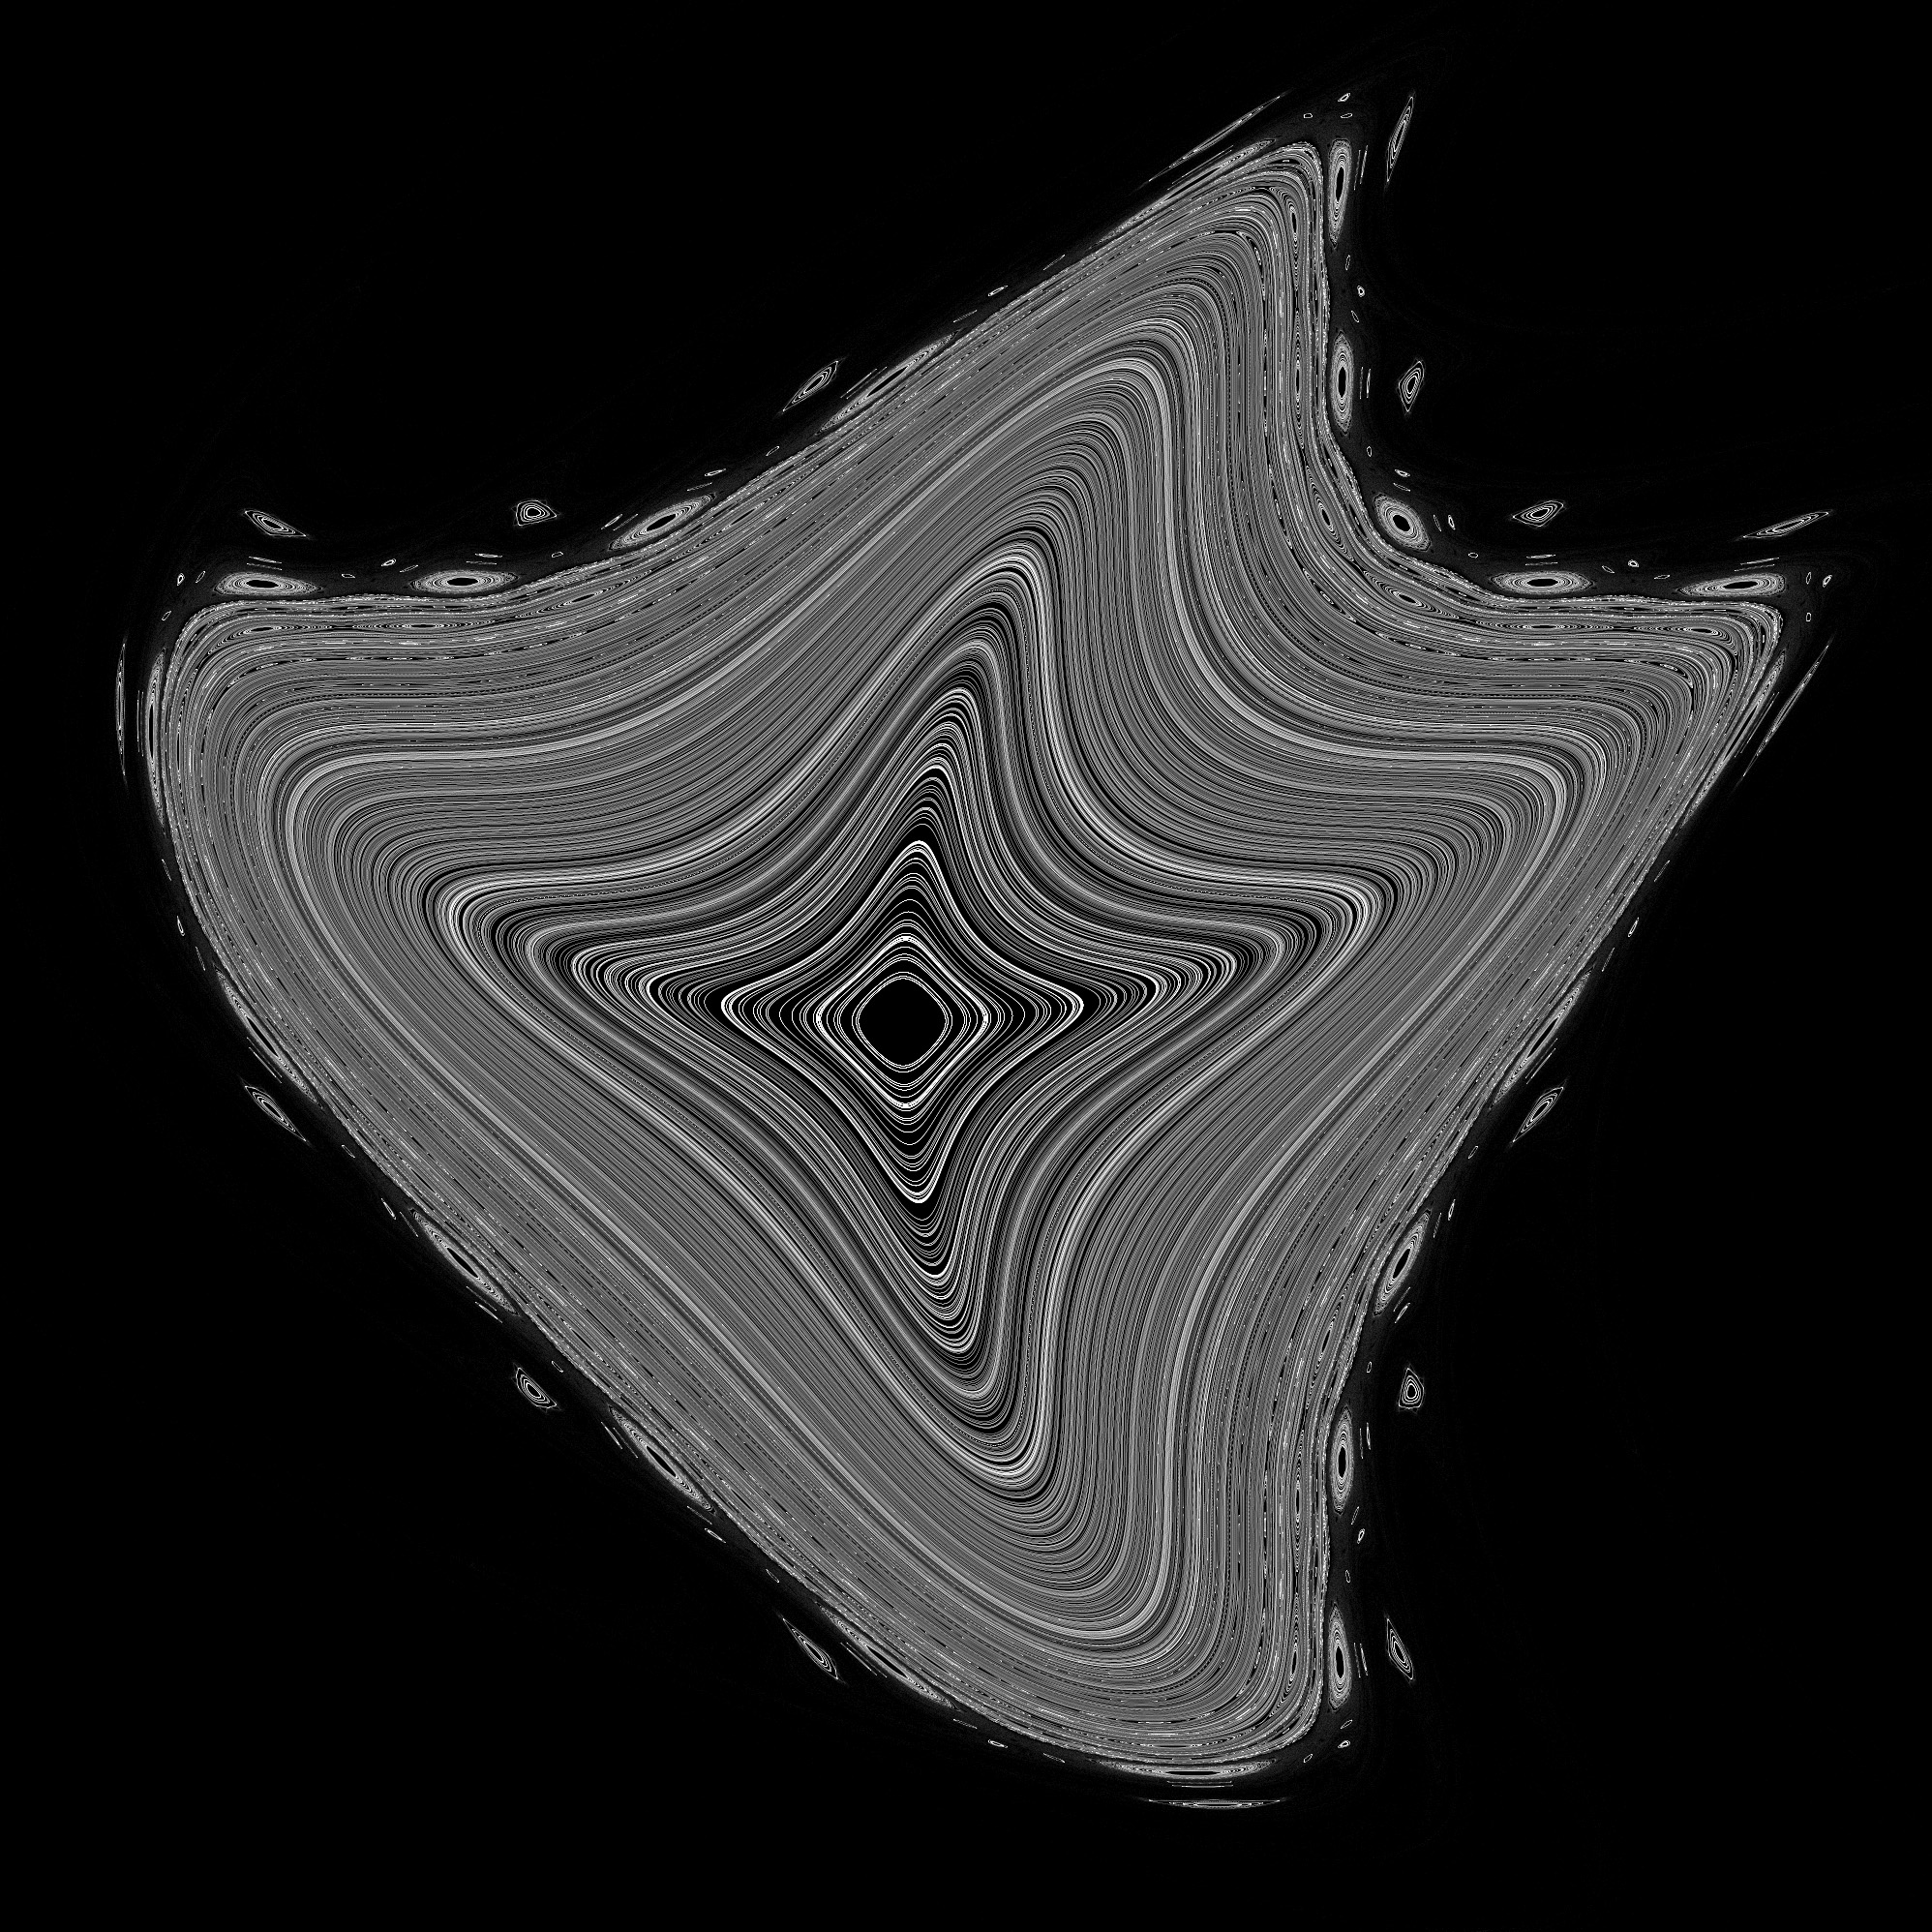
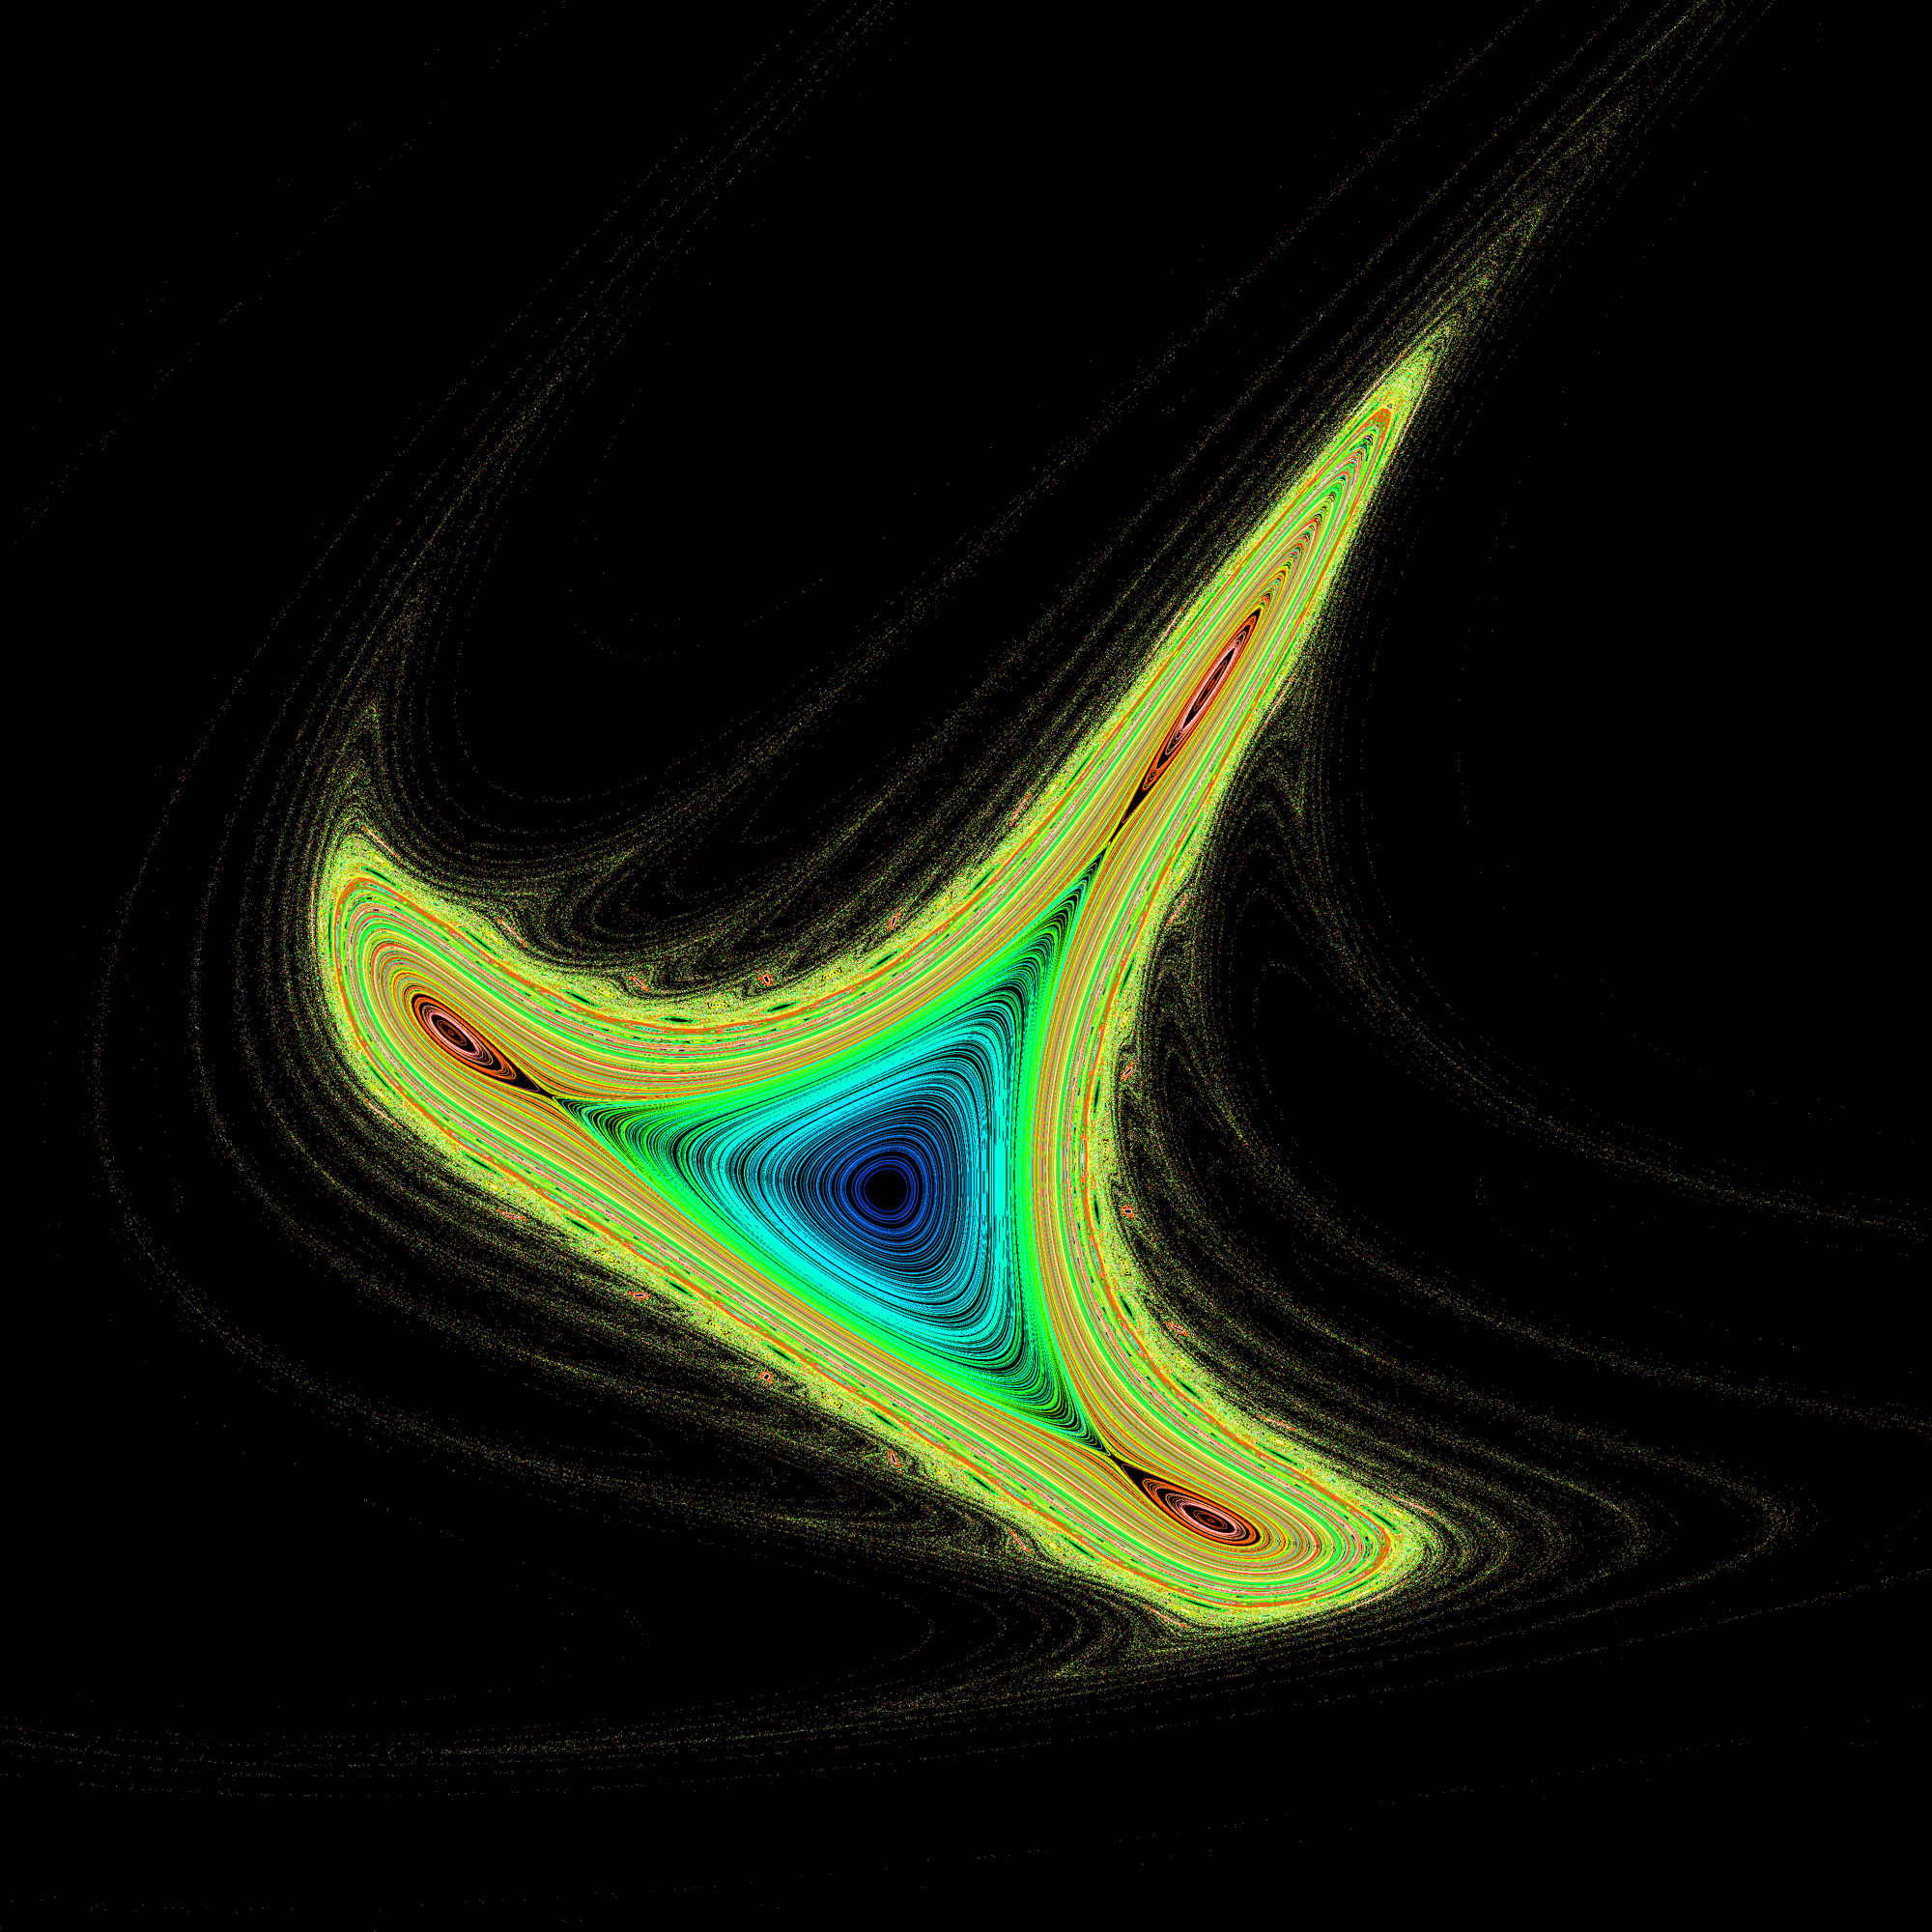
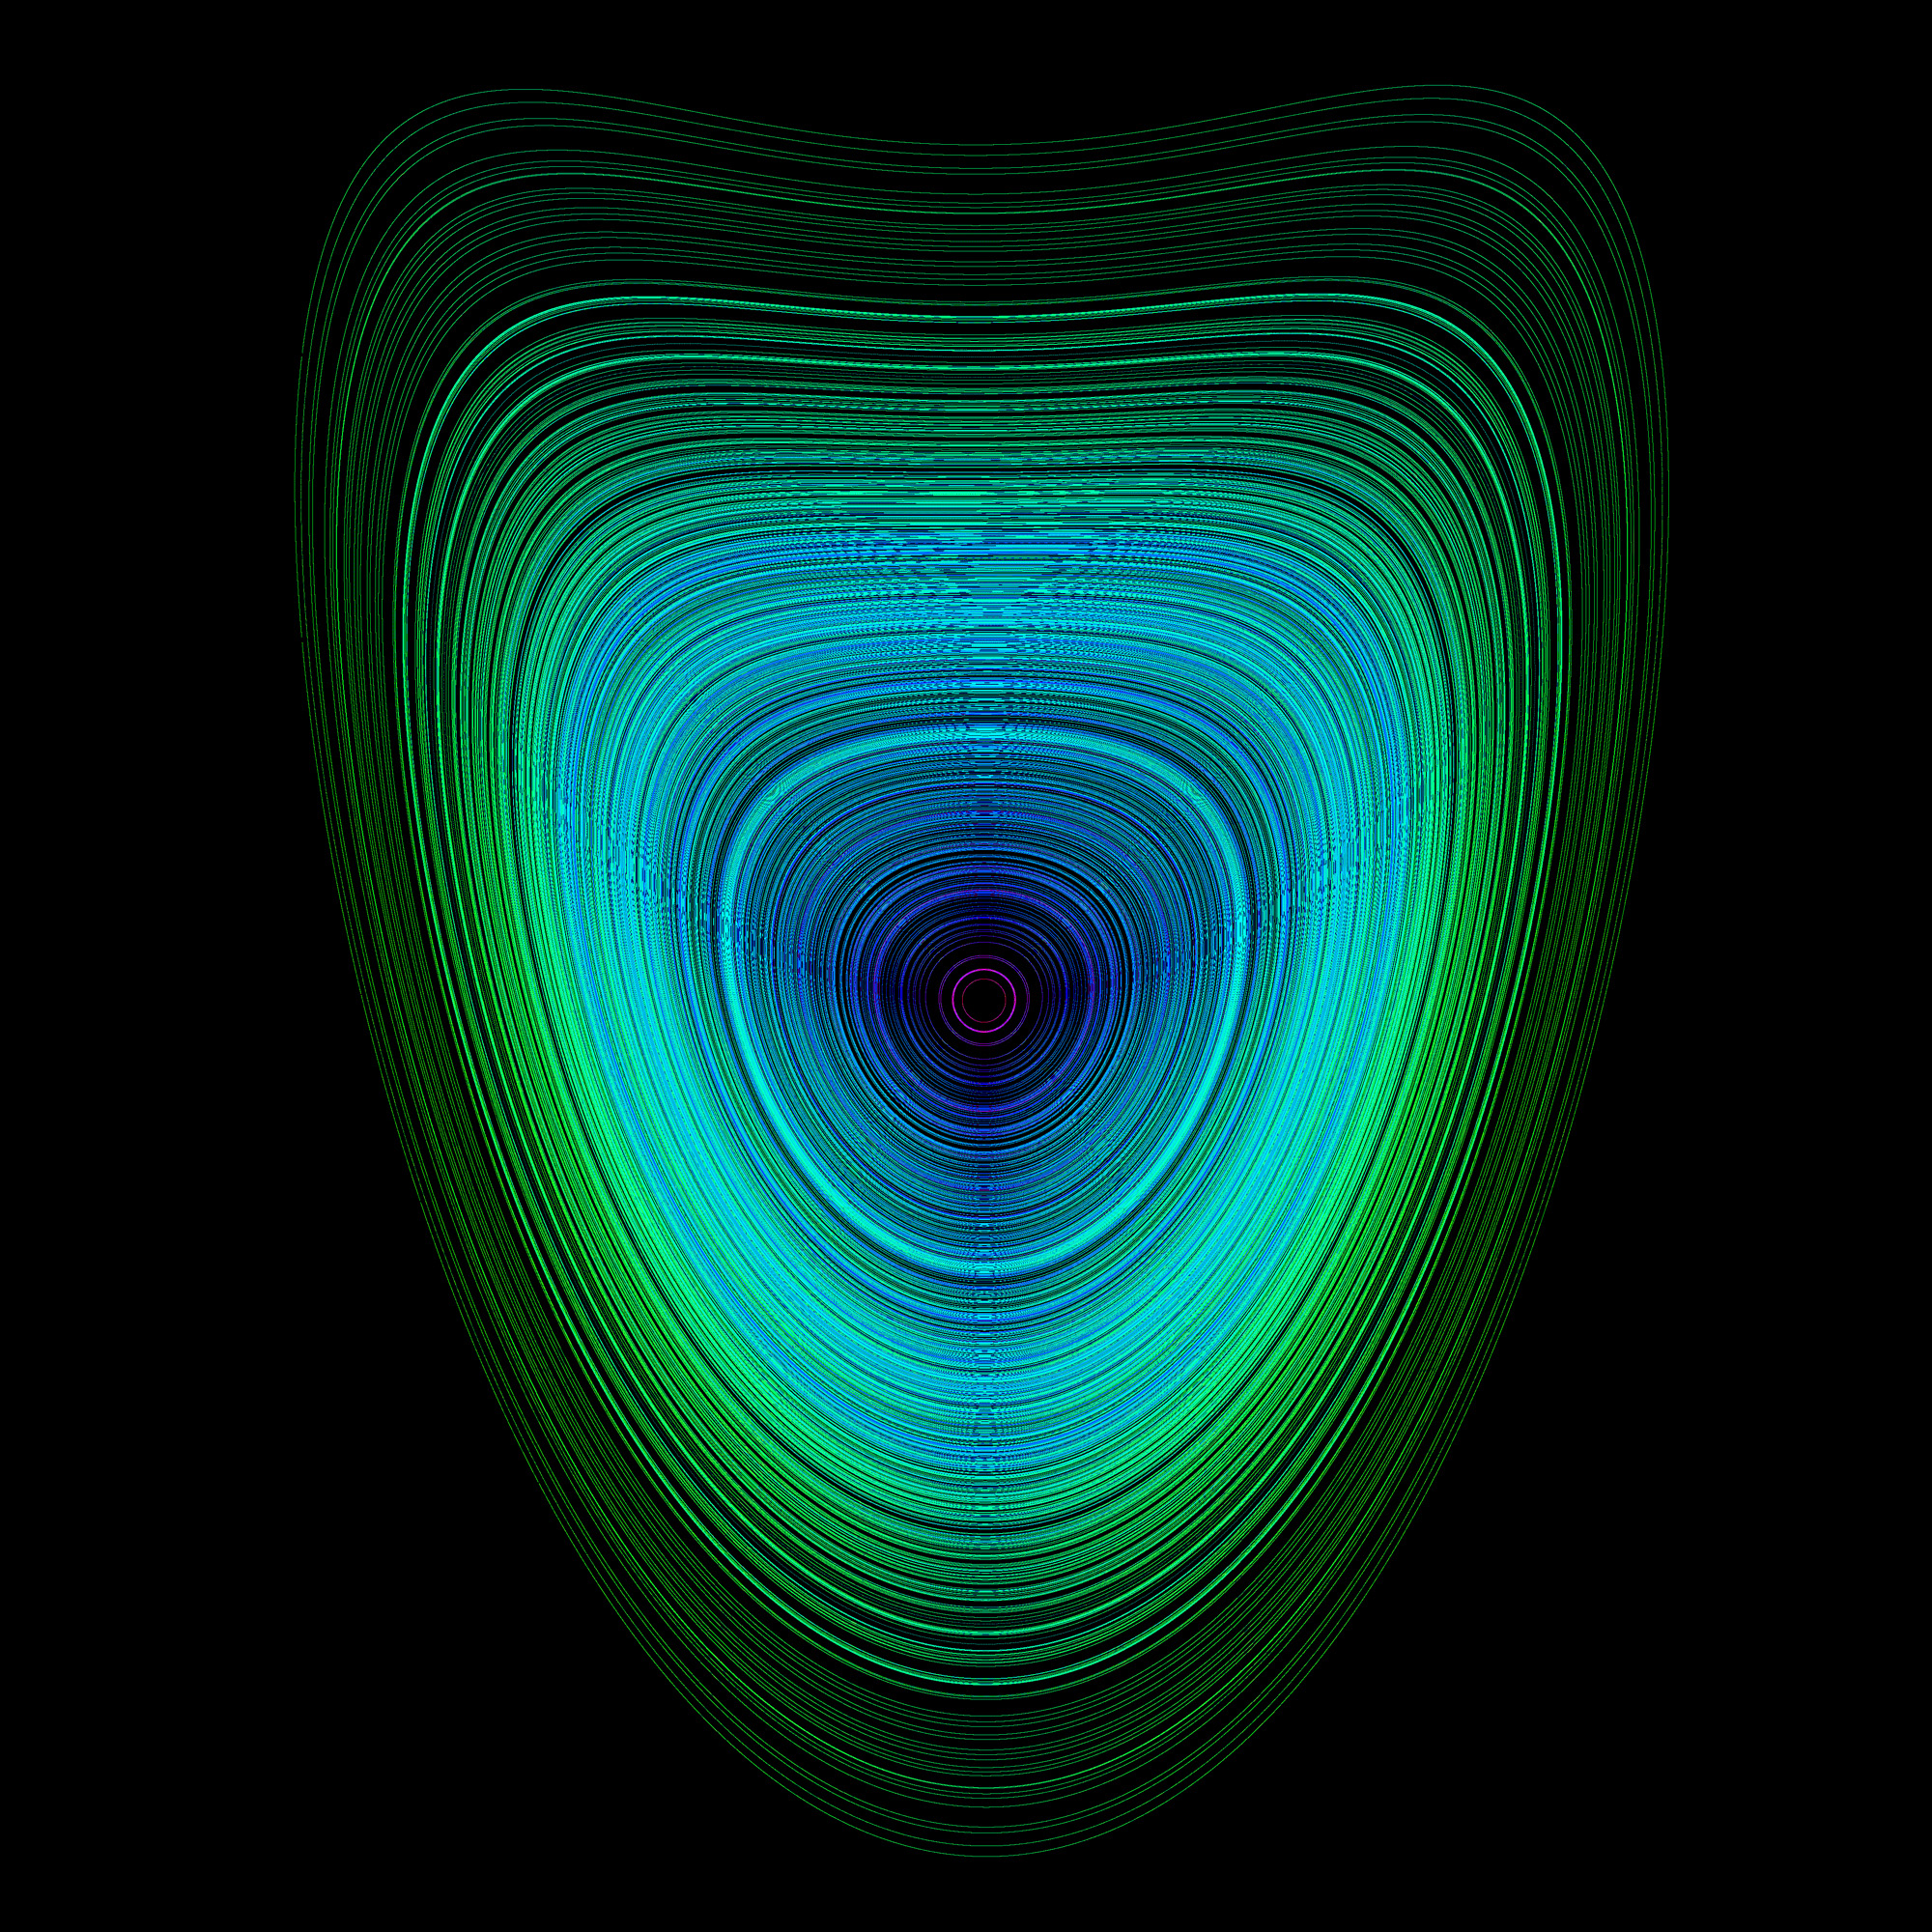
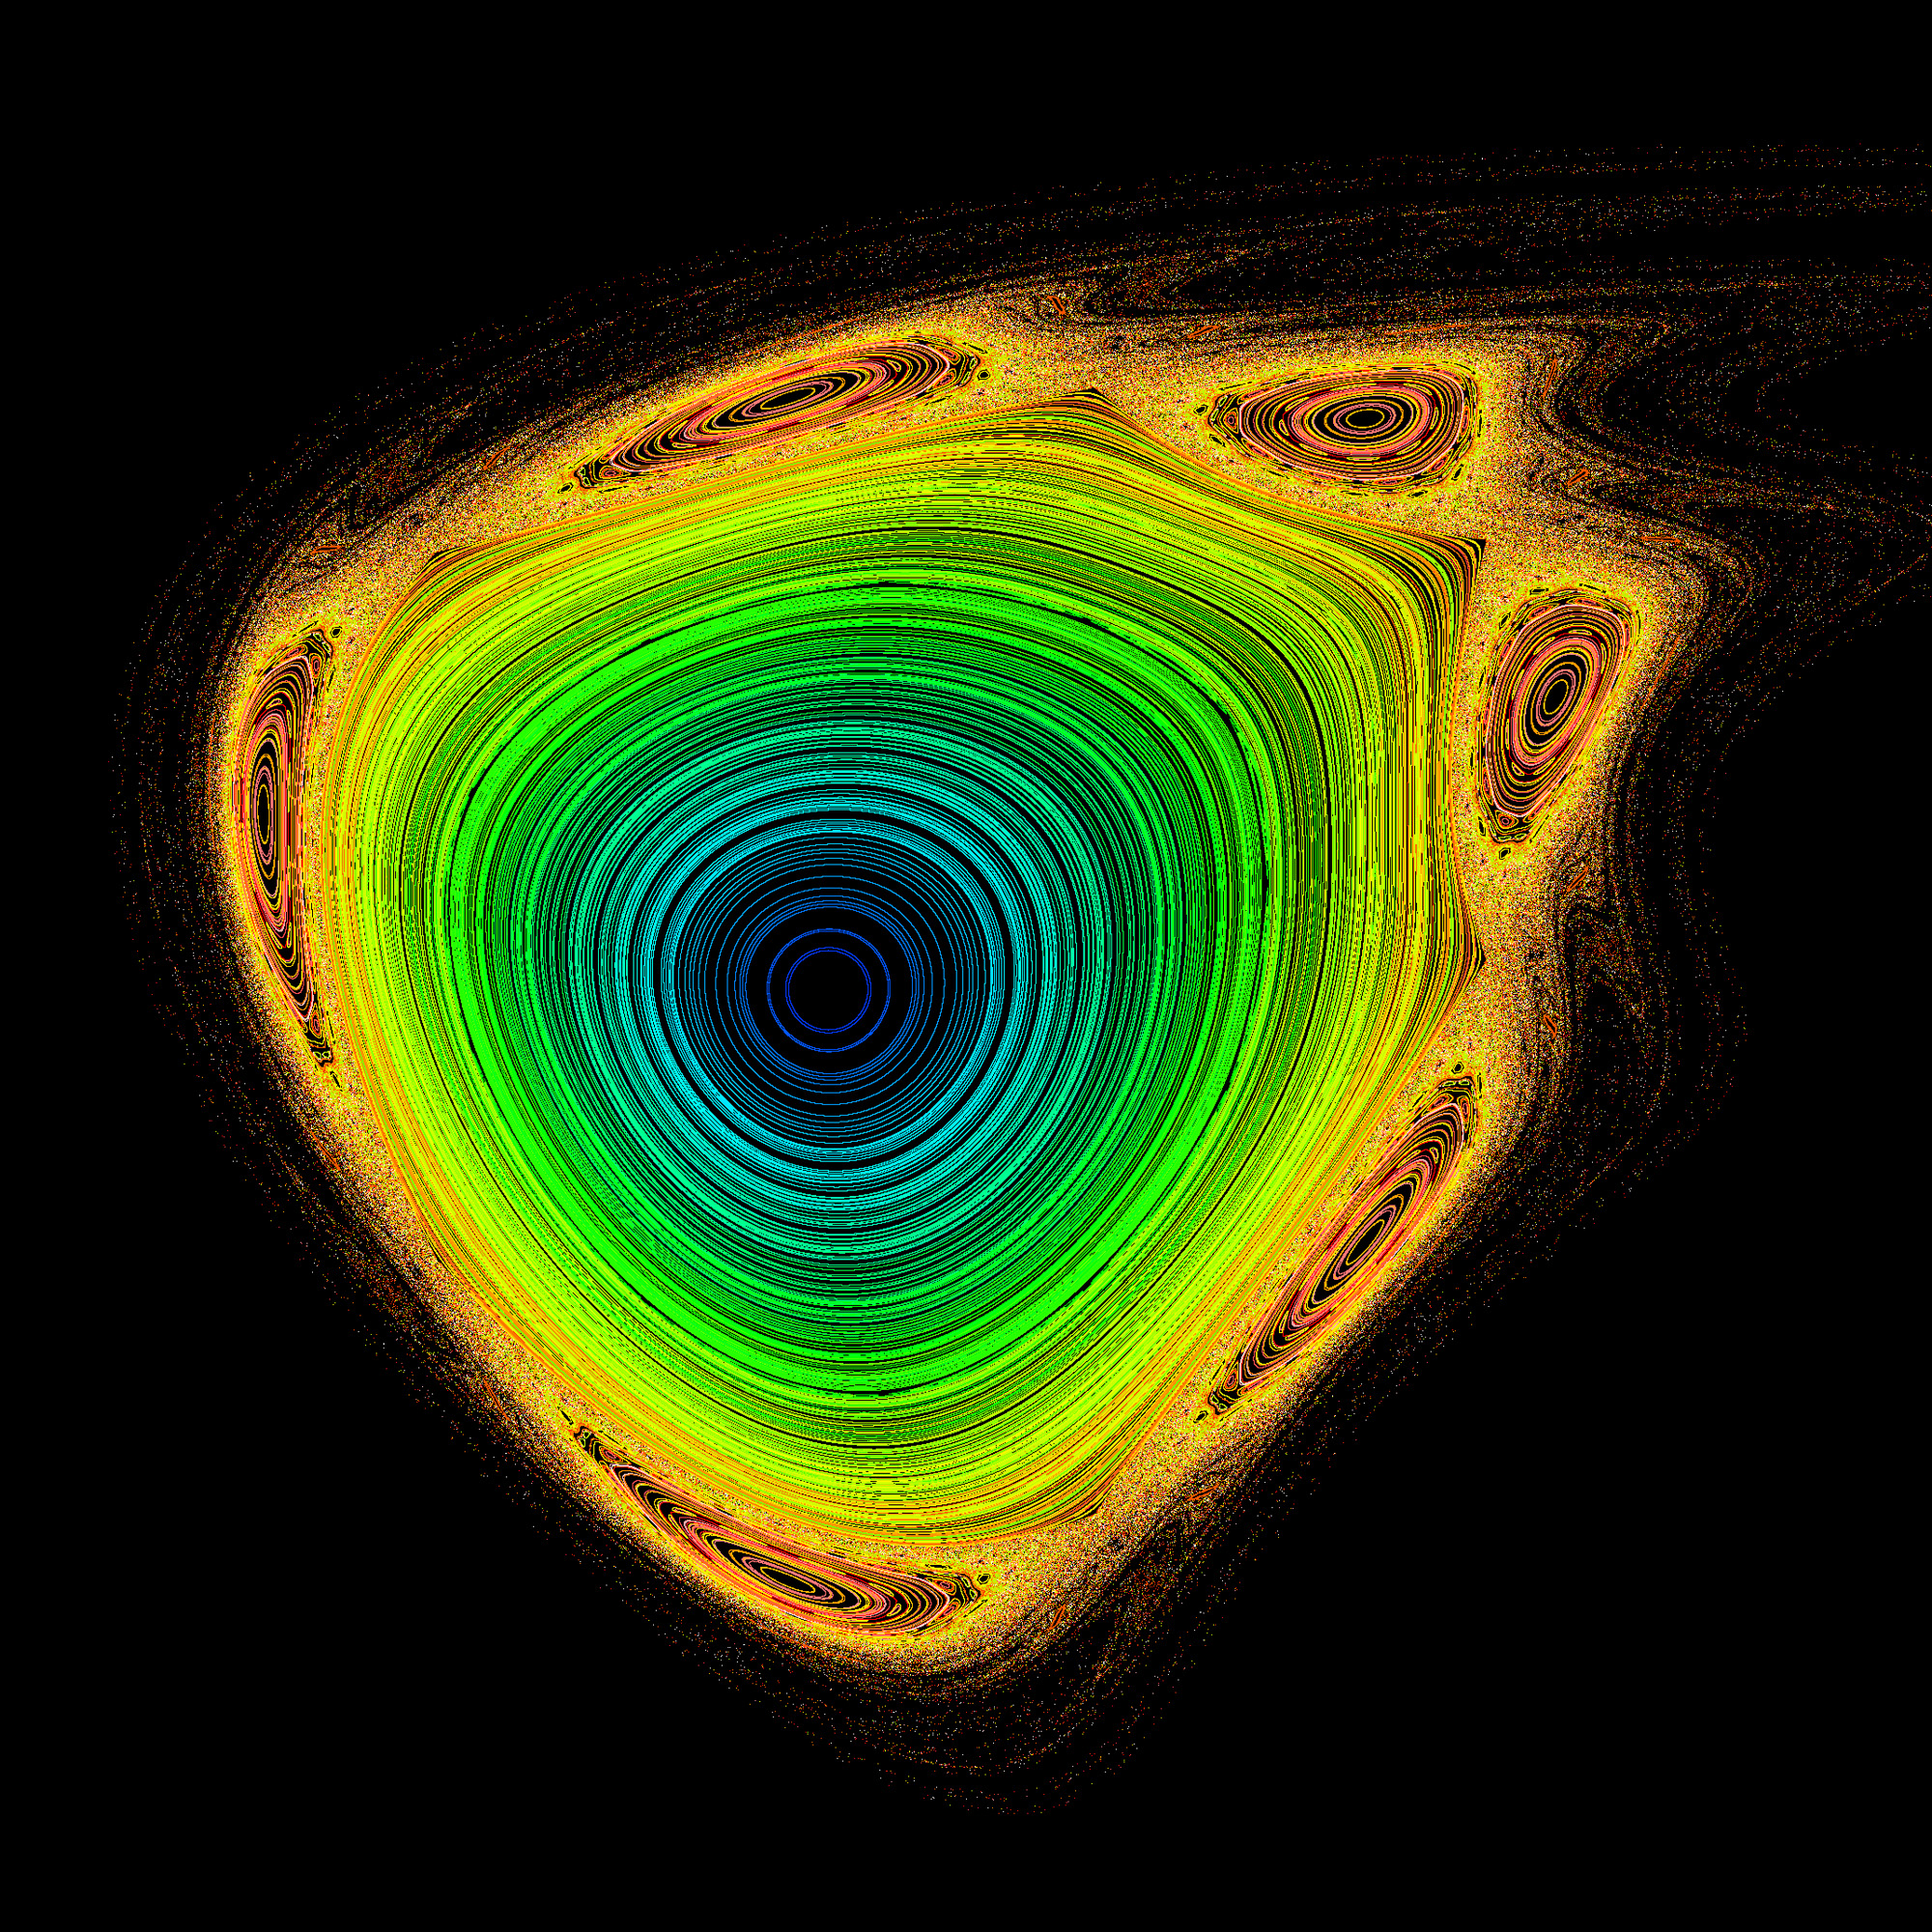
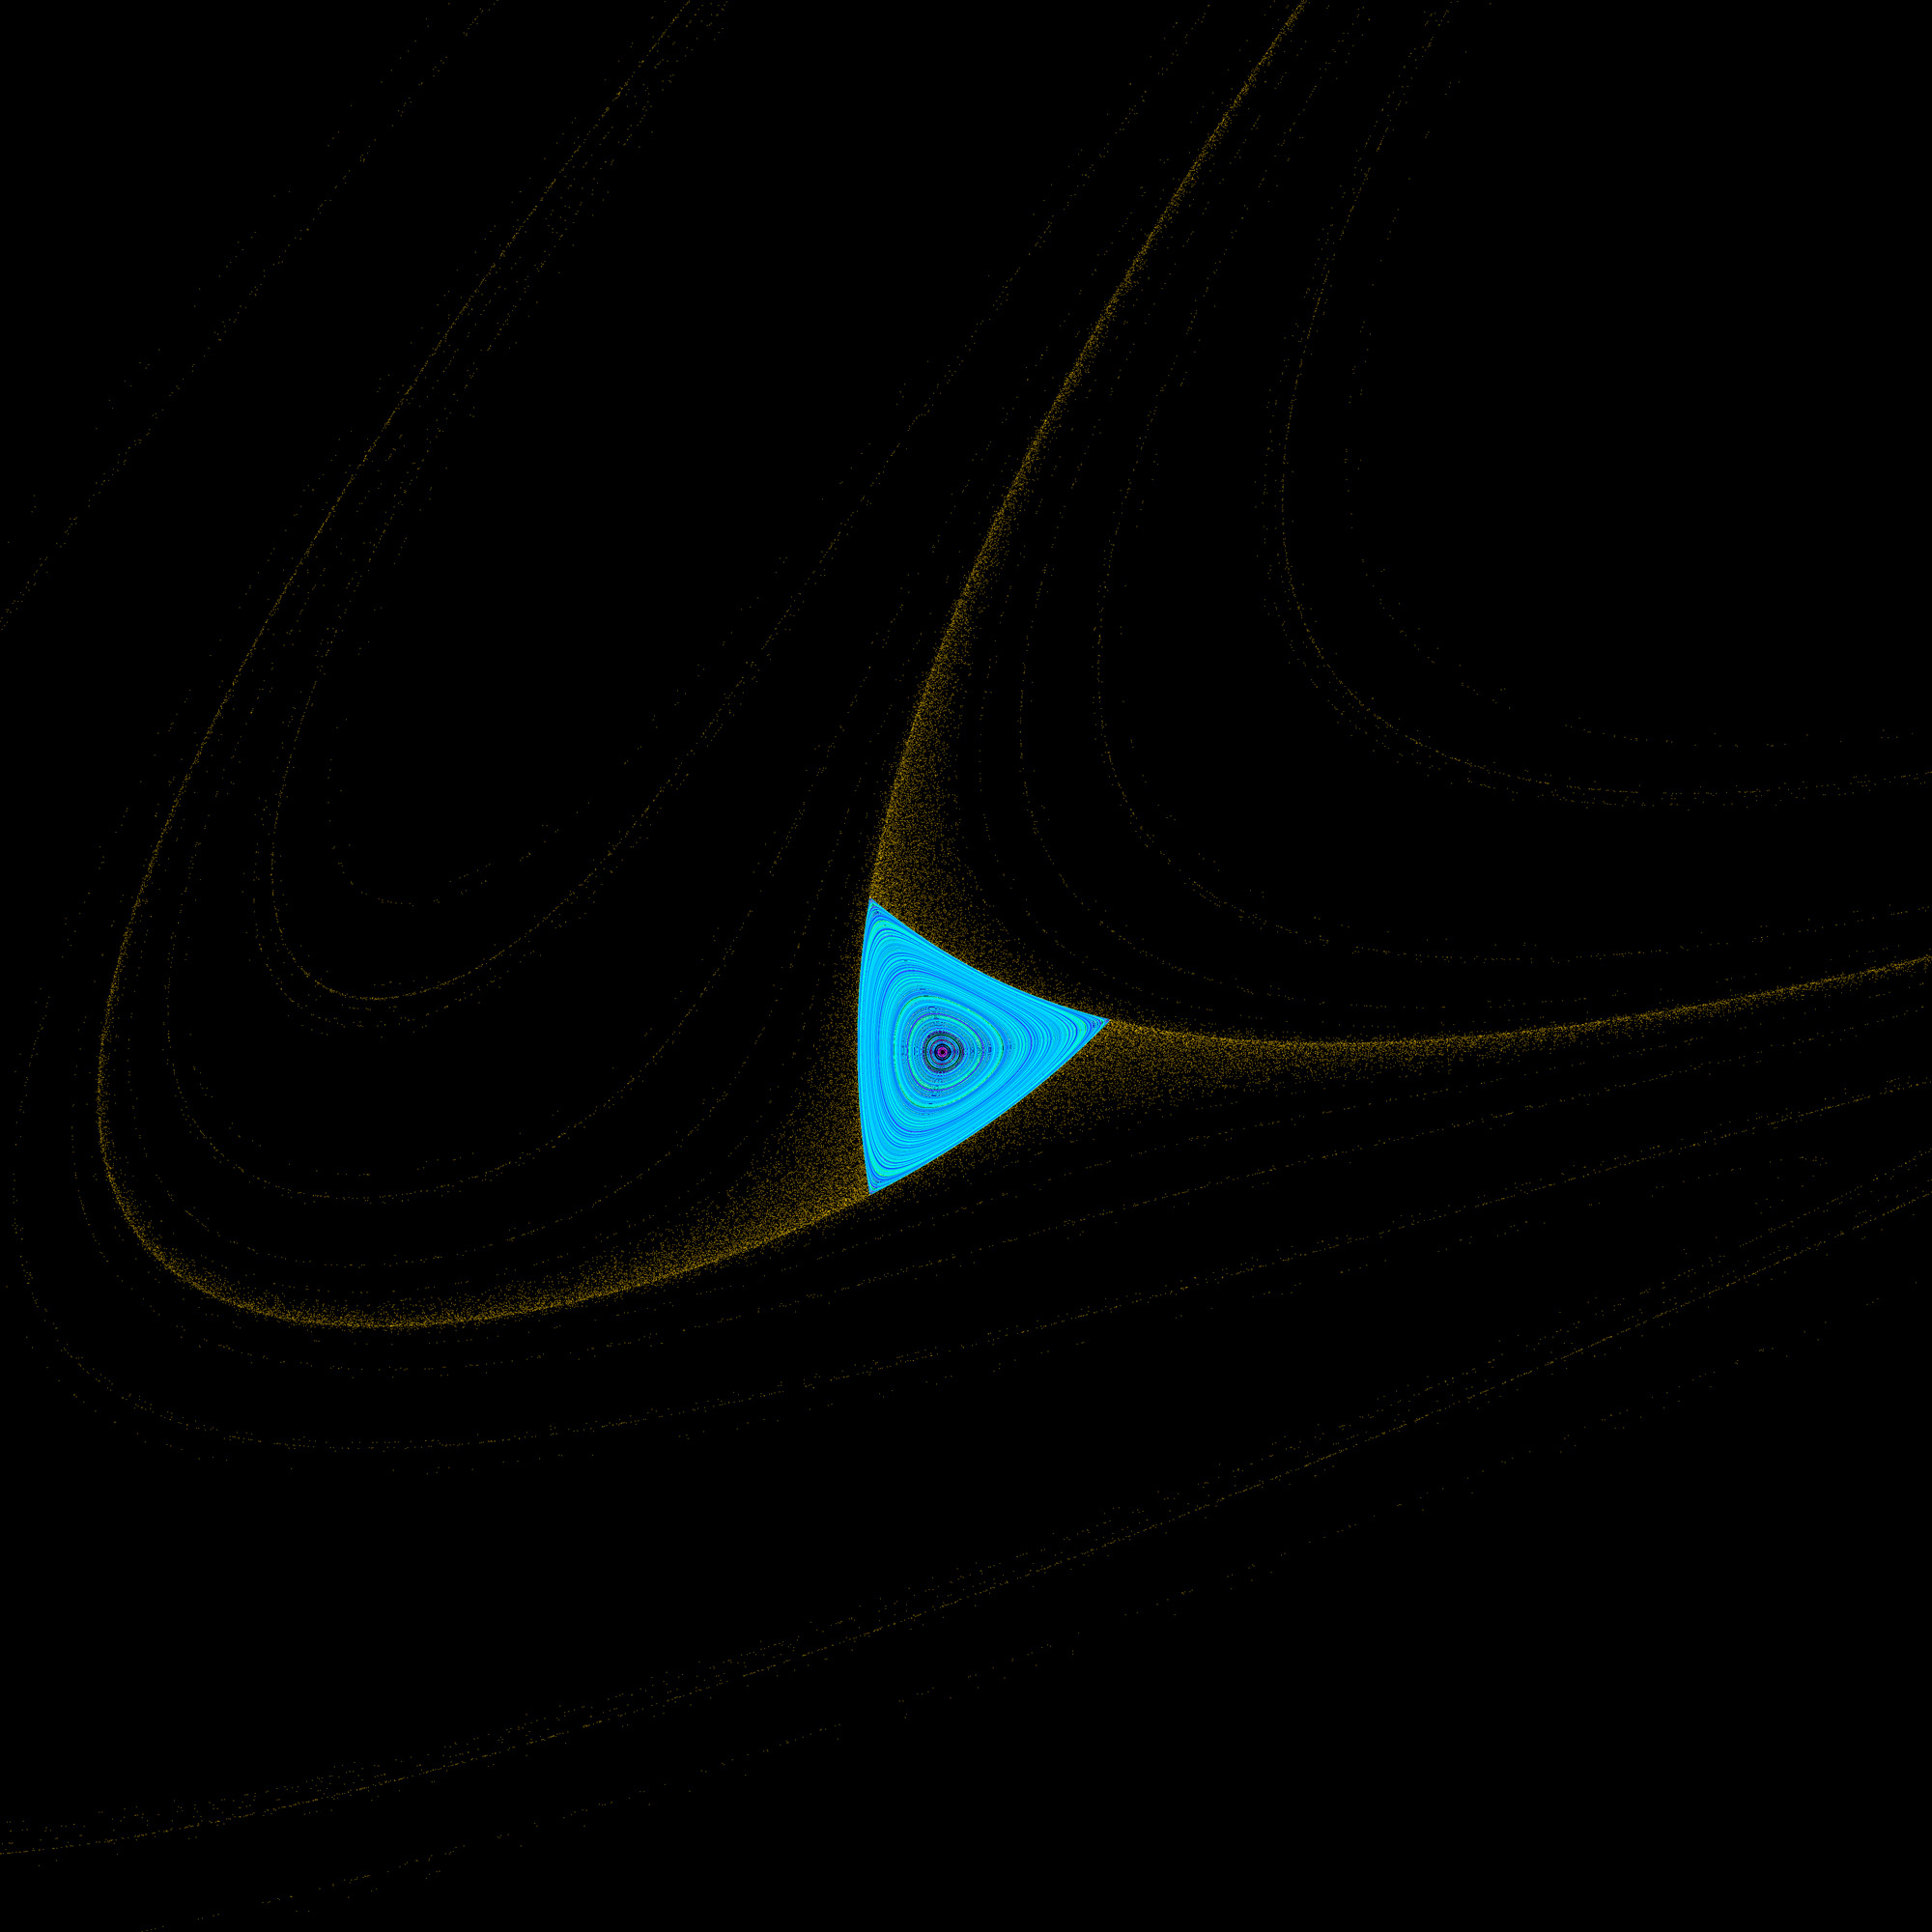
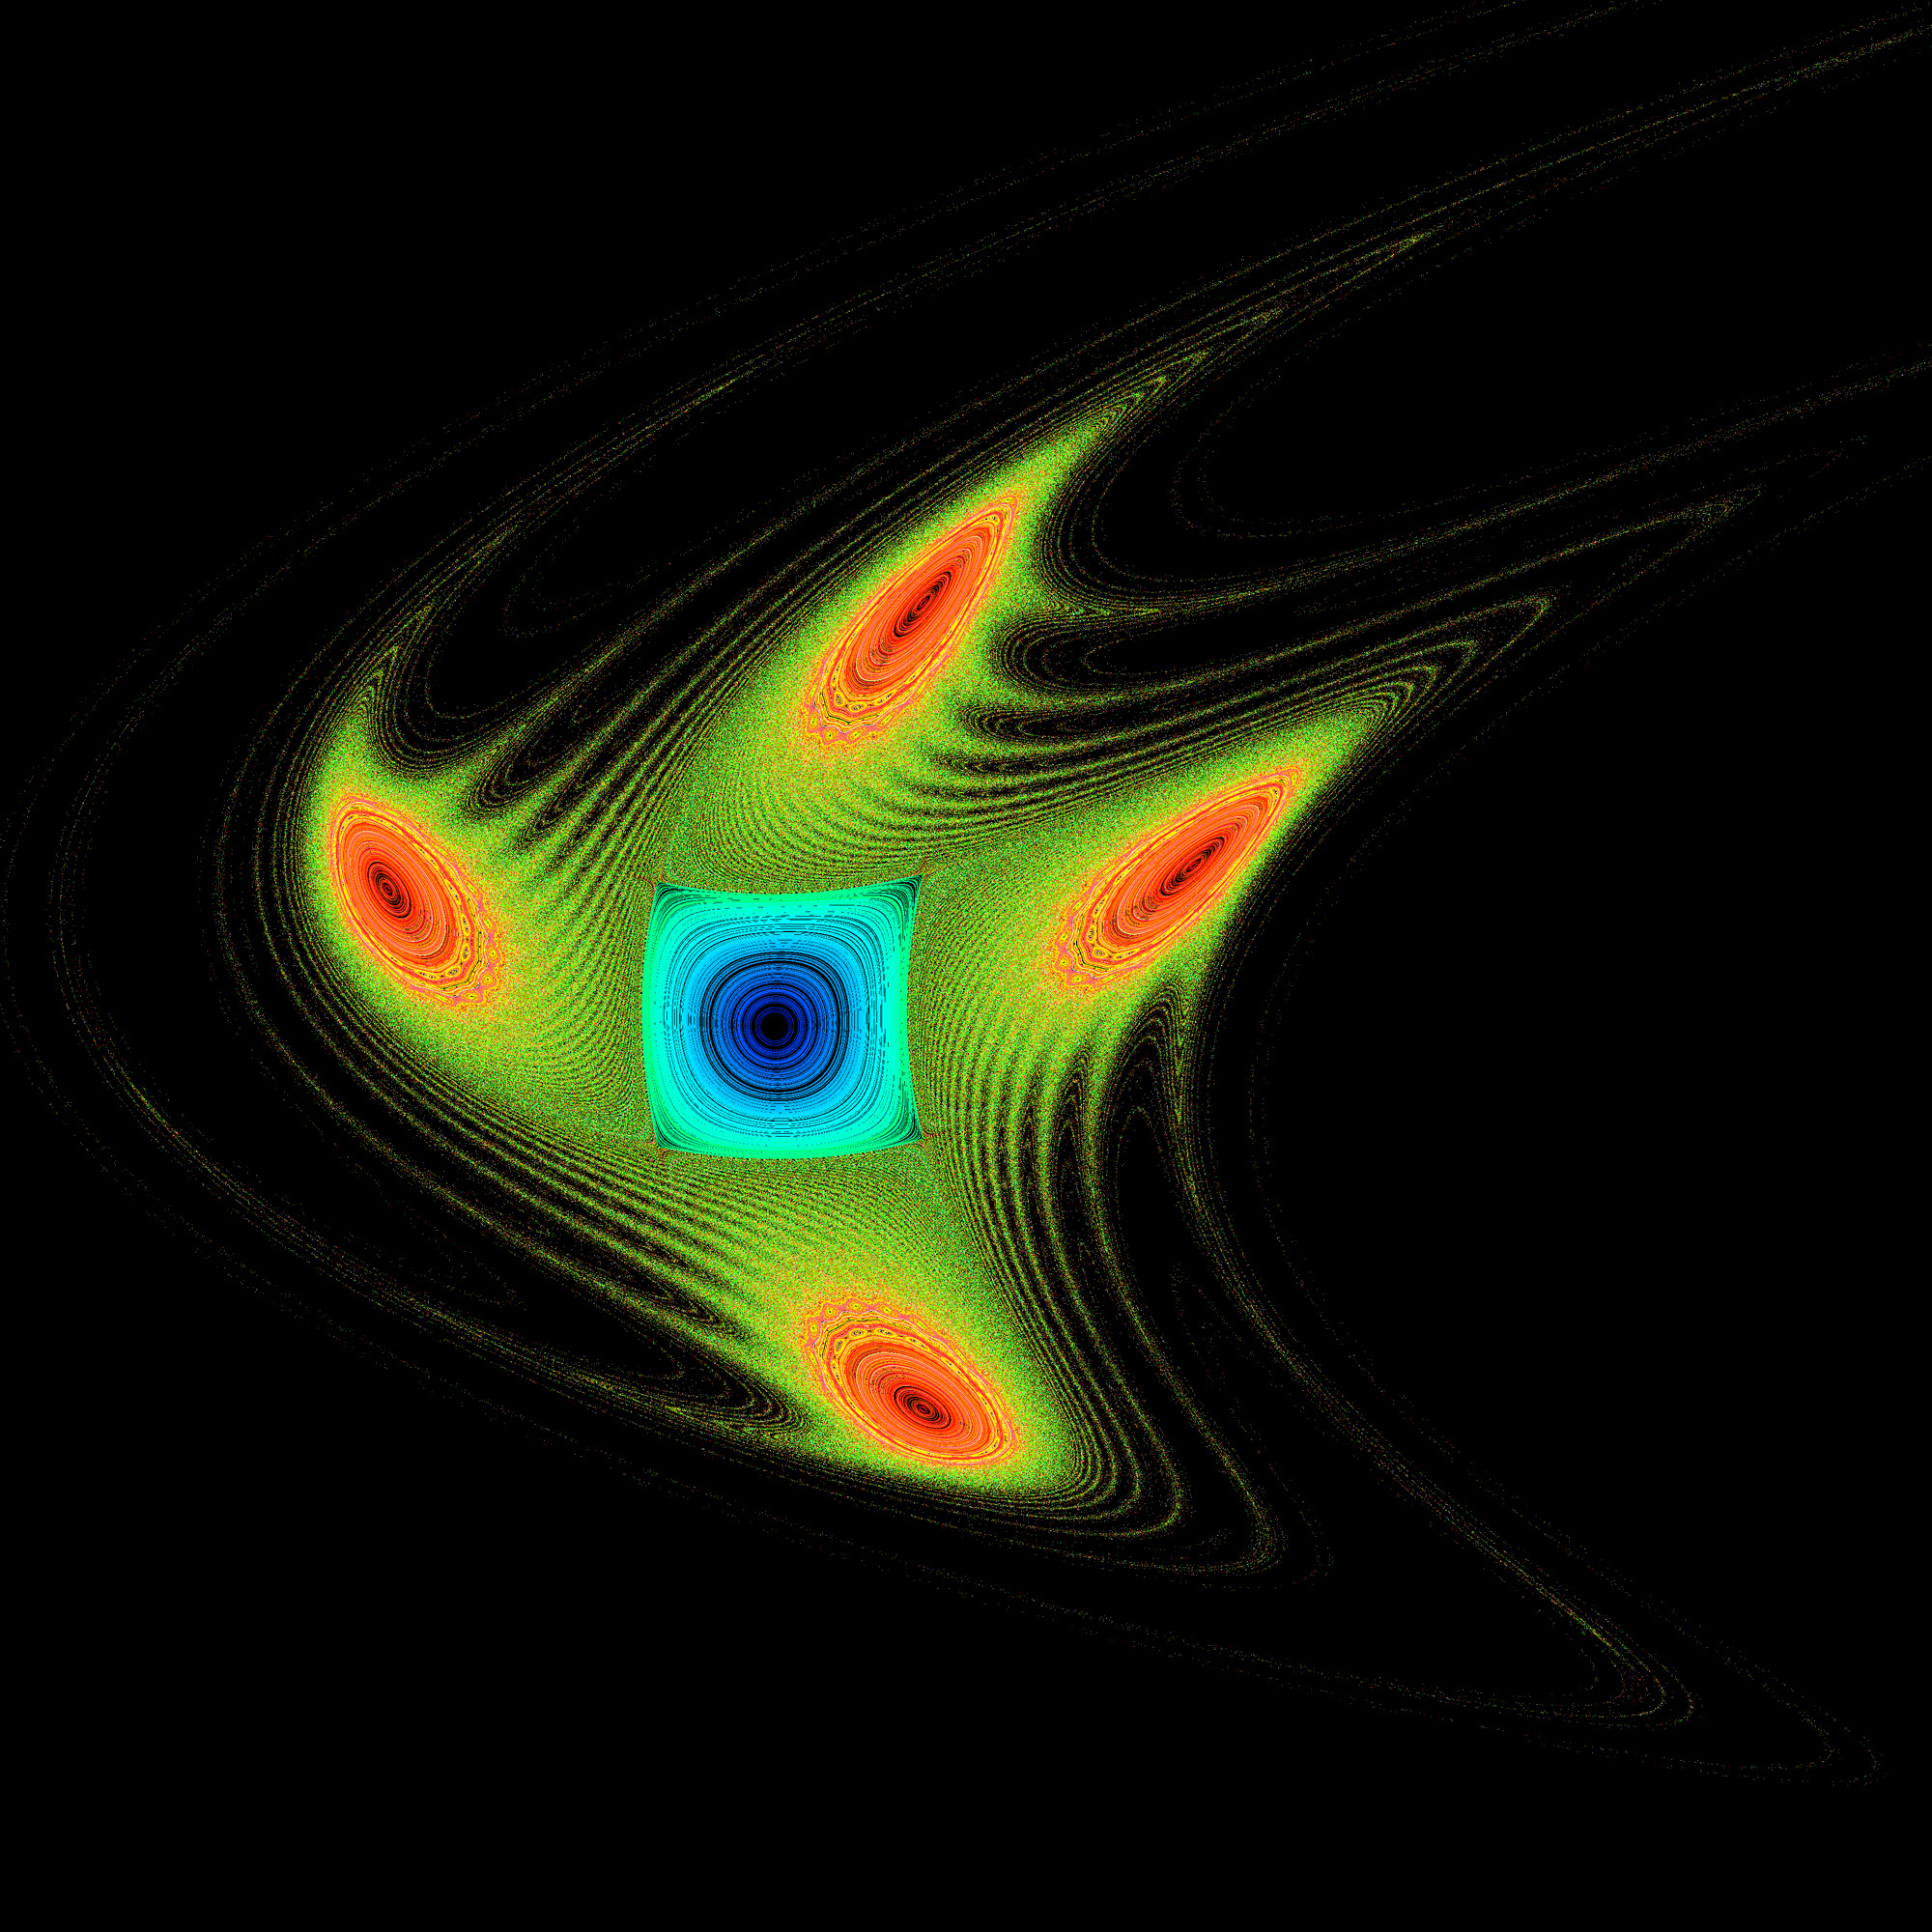
The Henon phase diagrams are illustration of the following series in 2 dimensions and with a single parameter "a". Each point on the plane (x0,y0) is used as the initial value of the series. yn+1 = xn sin(a) + (yn - xn2) cos(a)
|