Carotid Function FractalWritten by Paul BourkeApril 1998 So called "Carotid-Kundalini" curves of degree i are defined as where i ranges from 1 upwards, and -1 <= x <= 1 Superimposing the Carotid-Kundalini curves up to some degree on top of each results in a seemingly self similar structure.
First 10 curves 
First 20 curves 
First 30 curves 
Zooms 
C Source Extension to 3D The Carodit functions can be extended into 3D in a number of ways, the one used here is as follows where a and b are scaling factors.
The first 10 curves 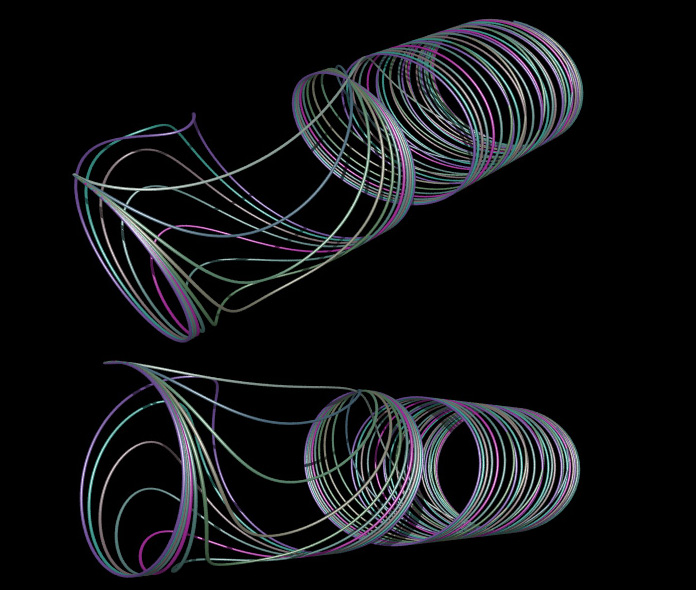
The second 10 curves 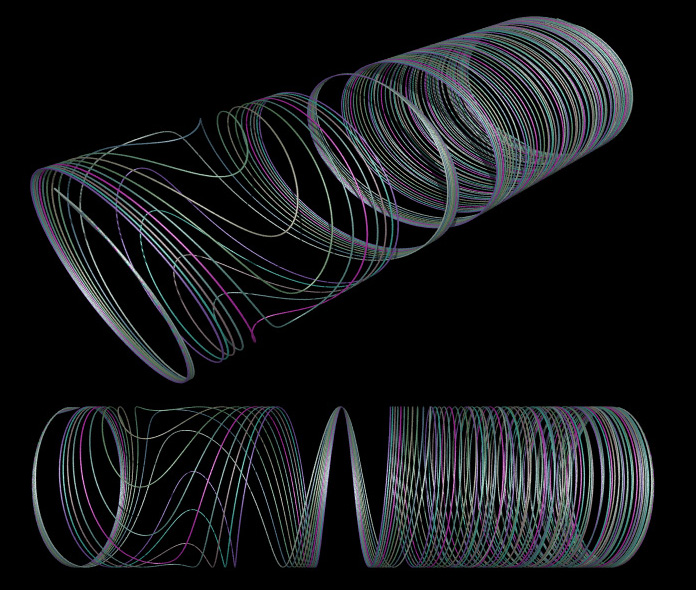
|